
Demand for flexible workspaces registered significant growth in recent years, mainly due to the wider availability of remote work and hybrid workstyles. At the same time, the uncertain economic waves led many businesses to downsize their office footprints and move past rigid, long-term leases toward more flexible and cost-efficient solutions. What’s more, according to a recent JLL report, the office sector remains under pressure in 2023, with tenants not only looking to increase efficiency and productivity but also to reduce their existing footprint and positively influence their bottom line.
So, to better understand the current state of the coworking industry across the U.S., this report leveraged the most recent proprietary data to break down the coworking space stock availability in the 25 largest markets, as well as their size and distribution.
National Coworking Supply Surpasses 5,600 Flex Workspaces in March 2023
As of March 2023, the national coworking space stock had reached a total location count of 5,612. As indicated by a recent report, coworking spaces have made their way not only into bustling urban cores with thriving business districts but also into several trending American suburbs, thereby highlighting once again their rising popularity among today’s workers who are no longer location-bound.
Use the cursor to see the data attributed to each market (number of coworking spaces and total square footage).
A large share of coworking spaces were concentrated in coastal markets, with significant numbers registered in Manhattan, Los Angeles, Washington, D.C., Boston and Houston. A commonality shared by all these markets is their flourishing business scenes that prove to be timelessly enticing for workers. And, especially during the pandemic years, coworking was a favorable solution in the above-mentioned areas, as it enables remote workers to continue their activities in a professional environment with lower costs and higher flexibility.
Coworking Spaces Claim More Than 113 Million Square Feet Nationwide
Per the most recent data, the U.S. coworking office space stock added up to 113,742,866 square feet, which accounted for 1.67% of the total office space nationwide. While that number is likely unevenly distributed across different spaces (depending on locations, markets, capacity and operators), it is still a number that has grown drastically since 2010, when JLL reported roughly 12 million square feet in flexible workspaces across the nation. That translates to a tenfold growth of this sector in the past 12 years.
National Median Prices for Virtual Offices, Open Workspaces & Dedicated Desks
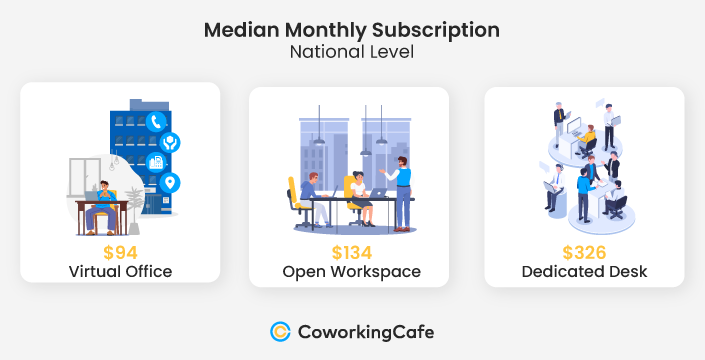
In terms of pricing, the national median rates for open workspaces were $134, while dedicated desks went for $326 and virtual offices for $94.
However, some markets stood out with median prices that were well above the national medians. Namely, Manhattan and San Francisco — two of the most populous and in-demand business hubs — boasted rates that, in some instances, were twice as high. Specifically, in Manhattan, the median price for an open workspace was $300 per month — more than double the national rate. On the opposite coast, the median price for the same subscription type in San Francisco was $357, or more than $200 above the national median for this type of arrangement.
Meanwhile, the Denver market also logged slightly higher prices in two of the three categories attributed to coworking spaces — open workspaces and dedicated desks — which checked in at $160 and $340, respectively. According to the most recent Yardi Matrix National Office Report, the office vacancy rates in Denver had soared as of January 2023, a fact that was largely attributed to remote work.
Similarly, the Census Bureau’s American Community Survey reported that 28% of Denver’s active labor force was working from home, which was one of the highest shares in the entire country. Therefore, although Denver claimed fewer than 200 flexible workspaces (significantly less than other top markets), the high demand that remote workers generate might justify the higher prices in this area.
For a more in-depth breakdown of coworking pricing in the top U.S. metros, see our latest study on coworking subscription prices.
Leading Markets by Number of Coworking Spaces
5 Markets Log Over 200 Coworking Spaces Each, with Manhattan as the Ultimate Leader
The old East Coast-West Coast rivalry also applies to the coworking supply, as Manhattan’s stock of 290 spaces was closely followed by the Los Angeles market, which logged 265 flexible workspaces. In both markets, the large populations and highly developed business sectors justify the need and demand for coworking spaces, as well as traditional offices. As recently reported, the demand for all types of office space was strongest in New York and Los Angeles, the two cities that were farthest along on the road to post-pandemic recovery.
Washington, D.C. had the third-highest number of flex workspaces in the country, at 243. Here, the government has been very open about embracing remote and hybrid work as a way of giving jobs in this sector a competitive market advantage. As such, it’s expected that coworking spaces will continue to rise in popularity as a favorable solution for many government employees. At the same time, data revealed that metro employment in Washington, D.C. grew at just 0.4% year-over-year, which was the lowest rate of growth among the top 25 markets we covered. This further reinforces the changes that are taking place in traditional offices as the number of employees is almost stagnating and many are shifting toward flexible office solutions.
Next, Chicago also boasted a healthy supply of coworking spaces with 235 locations. Here, office vacancy rates have continued to grow since the start of the pandemic, according to data from CBRE: while the vacancy rates in Chicago stood at 13.8% three years ago, they reached 21.4% at the end of 2022, mainly due to the rise of remote work and employees’ reluctance to return to the office. Likewise, Globest reported that the flight to quality and location was also apparent in Chicago — a sign that preferences surrounding workspaces were changing and the need for quality amenities was higher than before. In this regard, coworking spaces are likely to better suit the needs of today’s workers because most of them were built in more recent years, as compared to many traditional office buildings. Thus, the quality amenities and high-tech solutions were considered integral parts of these spaces from the very beginning.
Finally, Dallas-Fort Worth was the fifth and final metro to count more than 200 coworking spaces. More precisely, the area boasted a total of 225 flexible workspaces that benefit the high influx of businesses operating in the South.
At the other end of the spectrum, Fort Lauderdale had 67 coworking spaces (only one space less than Nashville, while Kansas City logged the lowest number among the top 25 markets, with just 52 flexible workspaces for its residents.
Leading Markets by Square Footage
Manhattan Coworking Logs Double the Total Square Footage of Runner-Up Market
Despite being hot on Manhattan’s heels as far as the number of active coworking spaces, Los Angeles had only half of the square footage of coworking inventory (6.75 million square feet, as compared to Manhattan’s 13.57 million-square-foot total). In fact, the large coworking footprint in the Manhattan market might even come as a surprise in an area that’s generally known for its spatially restrictive real estate.
Conversely, Fort Lauderdale was the market that offered the least amount of coworking space: it totaled only 1.26 million square feet — less than one-tenth that of Manhattan. And, in the Midwest, Minneapolis-St. Paul and Kansas City boasted slightly more space than Fort Lauderdale, totaling 1.39 million and 1.36 million square feet, respectively.
When looking at the average square footage per market, the gap between Manhattan and Los Angeles was even more apparent. Considering this metric, Manhattan (which had an average of more than 46,000 square feet) was followed at a distance by Brooklyn, which logged almost 20,000 square feet less. Chicago came in third in this ranking, followed (perhaps surprisingly) by Kansas City, which covered an impressive 26,000 square feet across its coworking spaces.
At the opposite end, San Diego, New Jersey and Denver had the lowest average square footage among their coworking inventory. In particular, San Diego had an average of 16,000 square feet per coworking location. Other markets that were below the national average in terms of space were Dallas-FortWorth, Miami, Fort Lauderdale and Minneapolis-St. Paul.
Distribution of Top Coworking Operators
Largest Coworking Operators Overtake Most Markets, but Smaller Players Are Predominant in Brooklyn
The top operators with the highest numbers of coworking spaces at the national level were industry giants Regus, WeWork, Industrious and Spaces. The first three had more than half of their total inventory in the 25 largest markets. Only Spaces had significantly more offices outside of these markets, with only 28% of its total portfolio in the top 25 regions.
However, while the national and often local monopoly attributed to large coworking players comes as no surprise, local or independent operators also made their presence known in some markets. For instance, in Los Angeles (where Regus is the ultimate leader with 43 locations), regional California operator Barrister Suites Executive also had 19 spaces.
The only market of the top 25 where small, local operators overtook large players was Brooklyn. Here, the only large operator in the market was WeWork, with four spaces, while local operators GreenDesk and WorkHeights boasted six spaces each. Two Trees also claimed five spaces in the Brooklyn market, overtaking WeWork.
Methodology
- To compile this report, we used proprietary data from CoworkingCafe to determine the number of coworking spaces per market, as well as the total square footage and the leading operators.
- The study relied solely on the listing data available on CoworkingCafe as of March 2023.
- The top 25 markets analyzed were established per our sister company, Yardi Matrix.
- In terms of pricing, we looked at the national median starting prices per person per month for virtual office, open workspace and dedicated desk coworking subscriptions.
Fair Use & redistribution
We encourage and freely grant you permission to reuse, host or repost the images in this article. When doing so, we only ask that you kindly attribute the authors by linking to CoworkingCafe.com or this page so that your readers can learn more about this project, the research behind it and its methodology.


