
Half a year in, U.S. coworking continued to grow at a steady pace, expanding 2.7% after a 3.2% uptick last quarter. In fact, in the last few months, the number of locations rose faster than total square footage, which means newer spaces are, on average, smaller. This is clearest across the top 50 markets: While large, established markets gained ground in both count and size, there were some fluctuations recorded that influenced their growth rate. On the other hand, most secondary markets made more significant strides by adding compact, flexible offices to meet steady demand.
Explore the Coworking Index →
Bigger Footprint, Smaller Spaces: How Second-Tier Markets Are Reshaping Coworking
The U.S. coworking industry grew 2.7% during the last quarter, going from 9,136 spaces nationwide to 9,384 — a net increase of 248 newly recorded flex offices. While a large share of these offices emerged in established hubs with strong coworking cultures, smaller markets also saw a steady expansion in the last few months, introducing more variety to their office supply.
At the same time, square footage had a more moderate increase compared to the number of coworking locations, going up 1.5% from 163.94 to 166.36 million square feet. This difference in growth rates led to a 1.2% drop in the average square footage (from 17,945 to 17,728 square feet), caused by the expansion into smaller markets with less commercial stock.
As a result of these gains in coworking inventory and square footage, shared workspaces now make up 2.34% of the national commercial real estate market, up from the 2.28% registered last quarter.
Regionally, the South holds more than one-third of the top 50 coworking markets, anchored by Washington, D.C.; Dallas; and Atlanta. Not far behind, the West is represented by 14 markets, including Los Angeles, Denver and San Francisco. Then, the Midwest and Northeast are neck and neck, both with nine entries.
Zeroing in on the numbers of locations, the South is at the helm with 2,640 flexible offices and the West trails behind with 2,056 locations. Boosted by a wider selection of coworking giants like Manhattan, N.Y.; Boston; and Philadelphia, the Northeast holds a slightly larger number of coworking locations than the Midwest — 1,419 versus 1,114 spaces, respectively.
Chicago Overtakes Dallas and Closes in on LA’s Crown
Los Angeles keeps its crown with 349 coworking spaces, despite a contraction of 1%. By contrast, Chicago gained 10 coworking locations (a 3% uptick) to edge past Dallas-Fort Worth and become the second-largest coworking ecosystem with 346 locations. Dallas saw a far more modest gain after expanding from 337 to 338 coworking spaces.
However, the largest gains were seen in Indianapolis, where there was a 14% increase: The market surpassed the 100-location mark to reach a total of 113 coworking spaces. Philadelphia posted impressive growth this quarter, as well, adding 13 locations to its existing 204 spaces.
Other large markets — like Phoenix, Seattle and San Francisco — also saw increases between 4% and 5% with inventories reaching totals of 185, 181 and 152 flex offices, respectively.
Meanwhile, second-tier markets expanded in parallel, adding coworking spaces to meet a growing demand for flexible office solutions. Namely, Salt Lake City has been inching closer to the 100-location mark with 99 locations. Similarly, Portland climbed to 79 workspaces and Sacramento went from 72 to 77 flex offices.
Even with a few fluctuations among the largest U.S. coworking markets, momentum in the sector hasn’t faded so much as relocated: The action is moving from the big metros to second- and third-tier markets, where demand still outpaces supply.
Total Square Footage Growing, But Not as Fast as Location Count
At the top of the leaderboard, Manhattan still comes first with the most extensive coworking footprint at 12.56 million square feet, despite a 2% contraction. Chicago, on the other hand, had a 2% rise in total square footage. At 9.27 million square feet, the market currently has the second-most-extensive coworking footprint.
Then, with 7.51 million square feet of flex office space, LA still records the third-highest square footage, despite a 3% quarter-over-quarter drop.
Moving past the big three, we see that a majority of the markets posted significant increases. In this case, Indianapolis leads with a 10.3% jump, going from 2.02 to 2.23 million square feet — a considerable surge that mirrors the market’s growth in coworking locations.
Likewise, other markets expanded their footprint this quarter, as well, most notably Philadelphia, with an 8% rise to reach 3.96 million square feet. It was followed by Columbus, which grew from 1.14 to 1.22 million square feet (+7.6%) — and Richmond–Tidewater, where Q2 delivered a 6.7% increase that lifted it to 1.37 million square feet.
Not to be outdone, smaller markets also added to their total square footage. For instance, after increases of 2%, 3%, and 4%, Jacksonville, the Southwest Florida Coast; and California’s Central Valley reached 0.75, 0.82 and 0.85 million square feet, respectively.
Besides Manhattan and LA, a few other markets also experienced contractions this quarter. Specifically, Washington’s total square footage dropped 1.5% to 7.32 million. Likewise, Houston’s square footage fell 2.7% to 4.92 million, while California’s Bay Area and Nashville each lost 1% of their coworking footprints.
Average Space Size Shrinks, but the Big Markets Still Loom Large
By the end of Q2, the average coworking size was 17,728 square feet — a slight drop from last quarter’s 17,945. In this respect, Manhattan still holds the crown with an average of 40,788 square feet per flexible workspace. For comparison, runner-up Chicago has an average of 26,801 square feet, while San Francisco comes in third with 24,386. Interestingly, Washington, D.C. and California’s Orange County are separated by just a few square feet with the former averaging 23,705 square feet per location and the latter standing at 23,703.
That said, the most notable gains in average square footage were in Brooklyn, where the average size reached 22,143 square feet this quarter for a 4% uptick. Similarly, Columbus, San Antonio; and Austin posted gains of 3.8%, 3%, and 2.7%, reaching 14,376; 14,649; and 18,975 square feet, respectively.
The broader takeaway is that U.S. coworking is settling into two distinct patterns: The largest markets continue to favor sizable, full-service spaces, while secondary and tertiary markets are growing through leaner, community-minded offices that fit tighter stocks of local commercial real estate.
Prices Remain Stable Nationwide, With Scattered Spikes in Virtual Office Subscriptions
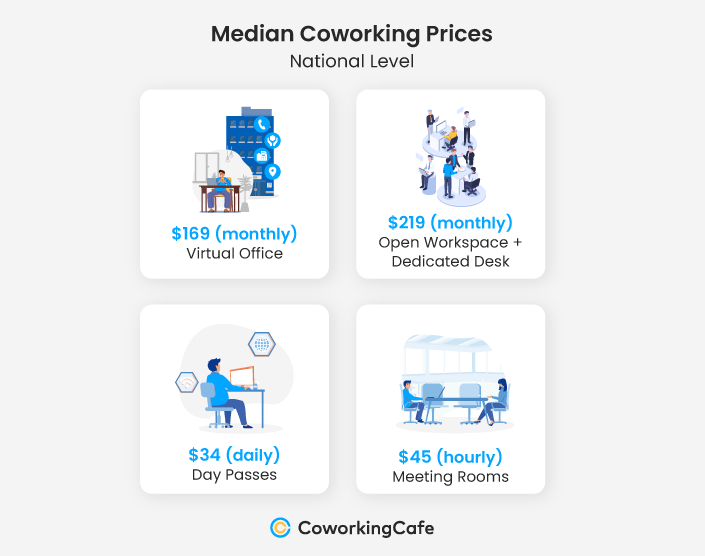
Nationally, coworking prices haven’t changed much over the past quarter; the median rate for memberships dropped by just $1, to $219 this quarter. Meanwhile, prices for day passes went up from $33 to $34, while meeting rooms and virtual office subscriptions held their ground at $45 and $169, respectively.
Granted, steady national prices signal stability, but zooming in on individual markets reveals some noteworthy changes. For memberships, Manhattan remains at the top of the chart. Though unchanged, its rate of $339 is still the highest in the nation. Then, with a median of $320, neighboring Brooklyn, N.Y., isn’t far behind, reinforcing strong demand outside of NYC’s central business district.
Across the Sun Belt and the East Coast, several major coworking hubs — including LA, Boston, San Francisco, Seattle, Miami and Austin — share a median membership price of $235. However, what stands out was that the rate wasn’t confined to the big metros. Instead, smaller neighboring markets — such as West Palm Beach–Boca Raton, Long Island, and Central Valley sit at the same $235 median, putting them on par with markets many times their size. Then, at $150 a month, Columbus and Jacksonville continue to offer the most affordable memberships.
Conversely, the highest rates for day passes are in Miami with a $45 median price. Then, New York’s Long Island and White Plains trail behind with $43 per day, followed by Brooklyn and Manhattan at $40, showing that the East Coast keeps prices high for open desks, as well. Notably, although rates in Cleveland–Akron rose $5 in the last quarter, this market, together with Sacramento, still offers the most affordable day-pass rates ($25 per day).
Sacramento also has the lowest median for meeting rooms at $30 an hour, the same as Salt Lake City. At the other end of the spectrum, meeting rooms in Manhattan cost $73 per hour or $3 more than last quarter.
As for virtual offices, medians vary between $99 and $215. Whereas price swings have been mild elsewhere, this segment shows sharper movement. To that end, Atlanta saw the greatest increase with its median virtual office cost rising $43 from $129 to $172. Less dramatically, median virtual office costs in LA and the Bay Area rose from $29 and $25 to $179 and $184, respectively.
There have also been significant decreases in some cases with virtual office rates dropping $16 in Fort Lauderdale and Orange County. The medians come to $159 for Orange County and $119 for Fort Lauderdale.
Regus Holds the Crown as the Top Operator, but Smaller Brands Fill in the Regional Gaps
At the end of Q2, Regus was still the clear leader with 1,031 locations in the top 50 markets and 1,285 nationwide. Of the 48 locations added this quarter, 37 are in first- and second-tier markets, indicating that growth was mostly focused in established coworking hubs with a few investments in smaller markets.
Runner-up HQ also posted noticeable gains this quarter, reaching 306 flex offices in the top 50 markets and 388 nationwide. HQ’s strategy this quarter was to add eight spaces in well-established markets while branching out with 10 more in smaller locations.
At the same time, Industrious chose tried-and-true urban markets, adding seven coworking spaces for a total of 190. Having 99% of flex offices among the top 50 markets, Industrious displays an expansion strategy unique to them.
Yet, while the top five coworking providers operate 2,184 of the country’s flex offices, the remaining 7,200 flexible workspaces — roughly 77% of the inventory — are owned by regional, independent operators.
Methodology
- To compile this report, we used proprietary data from CoworkingCafe to determine the number of coworking spaces per market, as well as the total square footage and leading operators.
- The study relied solely on the listing data available on CoworkingCafe as of July 2026.
- Due to refinements in our data collection methodology, some markets like White Plains and Inland Empire experienced oversized fluctuations that might not be an accurate representation of the current inventory and cannot be compared quarter-over-quarter.
- The top 50 markets analyzed were established by our sister company Yardi Matrix and were ranked based on allocated square footage.
- In terms of pricing, we looked at the national median starting prices per person per month for virtual office, monthly memberships (open workspace + dedicated desk), day passes (daily open desk coworking) and meeting rooms (hourly booking).
Fair Use & Redistribution
We encourage and freely grant you permission to reuse, host or repost the images in this article. When doing so, we only ask that you kindly attribute the authors by linking to CoworkingCafe.com or this page so that your readers can learn more about this project, the research behind it and its methodology.


