
Flexible workspaces are no longer expanding in every direction at once. Instead, the industry is growing with more intention, shaped by clearer demand patterns and a better understanding of what performs well over time.
Q4 reflects that shift: Growth continues, but it’s increasingly focused on scale, efficiency and proven markets. Rather than chasing footprint alone, operators are refining their portfolios; investing in larger, more versatile spaces; and consolidating where demand is strongest. The result is a coworking market that’s moving forward with intention and purpose.
Nearly 8,900 Locations Nationwide as Growth Tilts Toward Scale
By the end of Q4 2025, the U.S. coworking market reached 8,854 locations, up from 8,420 in Q3 to reflect a 5% quarter-over-quarter increase. Total coworking footprint rose in tandem, expanding from more than 152 million square feet to 159 million square feet for more than 7 million square feet in growth in a single quarter.
Despite the growth, coworking still accounts for just more than 2.2% of total U.S. office inventory, showcasing just how much runway remains. That said, operators appear increasingly willing to wait for the right building, the right submarket and the right tenant mix before committing their capital.
Location Growth Slows With Expansion Narrowing to Proven Markets
Expansion continued in Q4, but its geography narrowed. The U.S. coworking market reached 8,854 active locations by quarter’s end, up from 8,420 in Q3, with growth concentrated in a limited number of large, established markets, rather than spread broadly.
The theme coming out of Covid was operators bringing the office to the employee, with expansions in secondary and suburban markets to meet domestic migration trends. The theme looking forward seems to be where can operators and office building owners meet the needs of corporate occupiers that are committed to growing coworking and flexible footprints.
Peter Kolaczynski, Director Yardi Research
Los Angeles remained the largest coworking market by location count, closing Q4 with 338 active spaces after adding several net new locations during the quarter. This incremental growth reflects California’s fragmented, but resilient coworking ecosystem, where operators continue to layer new sites into established submarkets, as opposed to opening entirely new territories.
In Chicago, location counts increased to 328 spaces, marking incremental growth in an already dense market where flex workspace is a long-standing part of the local office mix. Similarly, Dallas-Fort Worth also pushed past the 320-location mark in Q4, reinforcing the metro’s role as one of the country’s most expansive coworking ecosystems.
Meanwhile, Washington, D.C. and Manhattan continued to post modest quarter-over-quarter increases, both reaching 310 and 299 locations, respectively. This aligns with broader industry trends showing growing adoption of flexible workspace in core business markets as organizations seek agility and hybrid work solutions.
In contrast, several mid-sized markets — including Raleigh–Durham, Nashville, and Columbus recorded flat or near-flat location counts in Q4. This pause suggests that operators appear to be focusing on maximizing performance at existing sites before committing to further expansion.
Overall, Q4 location data points to a clear strategic shift: Coworking operators are still growing, but are doing so selectively, reinforcing their presence in markets where scale, density and sustained demand are already in place.
Square Footage Parallels Location Count as Operators Bet on Scale
The shift toward selective expansion becomes even more clear when looking at allocated coworking square footage. By Q4 2025, total coworking inventory reached 159 million square feet, representing one of the strongest quarterly increases of the year.
This growth was driven largely by expansions within existing markets, versus the addition of many new locations. Here again, Manhattan continued to dominate in total footprint, closing Q4 with more than 12.4 million square feet of coworking space.
A similar pattern played out in Chicago, where total coworking inventory climbed to nearly 9 million square feet. While square footage continued to grow, the increase in site count kept pace, leaving average location sizes broadly stable.
Further west in Los Angeles, coworking inventory surpassed 7.4 million square feet in Q4. As Los Angeles added locations, square-footage growth largely kept pace, pointing to steady, evenly distributed expansion rather than a shift toward larger-format spaces.
The South also saw significant gains: Dallas–Fort Worth expanded its coworking footprint to roughly 6.7 million square feet, an impressive 15% increase from Q3. Here, square footage gains were closely tied to new, larger-format locations, rather than an increase in small offices.
Nationally, the average coworking site size remained steady at more than 18,000 square feet, but this stability masks a widening gap between large and smaller markets: In dense, urban centers — such as Manhattan and Chicago — average site sizes exceed 25,000 to 40,000 square feet, while many secondary and suburban markets remain closer to or below the national average.
From Premium Peaks to a Pricing Plateau, Flex Rates Show Sign of Maturity
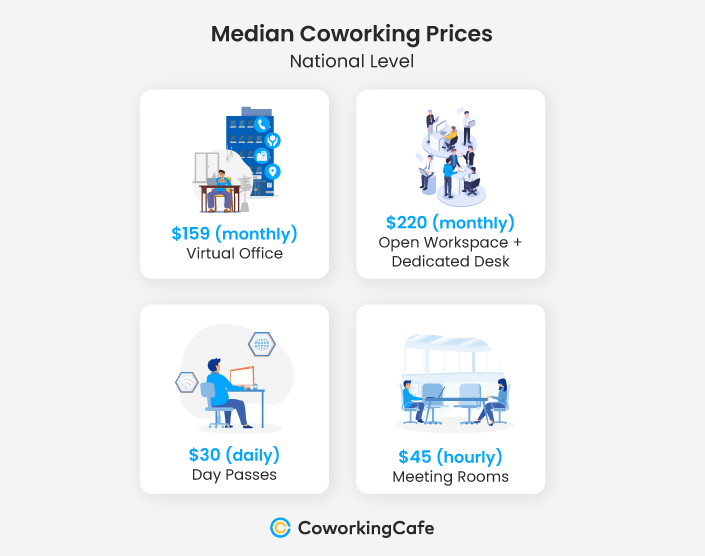
In Q4 2025, coworking prices across the U.S. didn’t move much, signaling a market that found its footing. National median rates for open and dedicated desk memberships dropped slightly from $225 to $220 per month, while day passes remained at $30, meeting rooms sit at about $45 per hour and virtual offices gravitated near $159 per month. Quarter-over-quarter, there were no meaningful shifts in headline pricing, marking a clear transition from adjustment to balance.
 Once again, Manhattan continues to set the upper echelon for coworking costs, but, even here, prices have stagnated their climb. Specifically, median monthly memberships held at $339 with meeting rooms renting for roughly $67 per hour and day passes at $39. Nearby, Brooklyn trails closely behind with memberships at around $320 per month, reinforcing that strong demand still extends beyond the traditional central business district, yet without triggering further price escalation. In Q4, premium markets seemed to preserve their position, rather than pushing it higher.
Along the West Coast, San Francisco, Los Angeles, and Orange County remain clustered in a high-priced tier between $230 and $235 per month. Despite continued additions to inventory, prices across these markets stayed tightly grouped with operators relying on space quality and scale, as opposed to rate increases, to compete.
Otherwise, in the South and Midwest, pricing stability is closely tied to scale. Dallas-Fort Worth, Houston, Atlanta and Miami all sit squarely around the national median with memberships typically ranging from $200 to $235 per month. Additionally, larger, newer locations appear to be absorbing demand efficiently, thereby allowing prices to remain steady while still maintaining healthy occupancy. At the same time, day passes across these markets continue to fall mostly between $30 and $40, keeping them accessible to hybrid workers and small teams.
At the more affordable end of the spectrum, the efficiency markets show a similar pattern: Salt Lake City; Columbus, and Jacksonville held median membership rates near $150 per month in Q4, yet without signs of pricing pressure. Plus, several of these metros expanded their average site sizes during the quarter, indicating that lower prices are increasingly paired with larger, centralized locations, instead of smaller, suburban offices.
Taken together, the lack of quarter-over-quarter price movement in Q4 reflects a market that has settled into its range. The Northeast remains the most expensive, the South continues to offer the most balanced value proposition, and the West spans from premium coastal hubs to more cost-efficient inland metros. Rather than signaling stagnation, pricing stability in Q4 underscores a coworking sector that now prioritizes predictability, utilization and long-term demand over short-term rate growth.
National Operators Consolidate as Local Brands Refine Their Roles
Operator data in Q4 highlights a market that continues to consolidate at the top, even as smaller players refine their strategies instead of chasing scale.
Regus remains the clear national leader, closing Q4 with nearly 1,200 locations across the U.S., including more than 950 sites in the top 50 markets alone. As such, its footprint far exceeds that of any other operator, reinforcing Regus’ role as the primary provider of enterprise-oriented flexible office space across major business hubs.
Among the next tier of national brands, HQ operates nearly 300 locations, while Industrious and Spaces each maintain slightly more than 150 locations nationwide. Collectively, these operators account for a substantial share of the country’s 159 million square feet of coworking inventory with a strong concentration in dense, urban markets where demand from corporate and institutional users remains most consistent.
Not to be outdone, VAST Coworking (spanning Intelligent Office, Venture X and Office Evolution) expanded modestly in Q4, adding just two new spaces to reach 182 locations nationwide.
Settling Into Scale: A Year-Over-Year Look
Viewed against Q4 2024, the pace and direction of coworking’s growth become even clearer. Nationally, the number of coworking locations increased a whopping 15% from 7,695 to 8,854. Total footprint expanded in parallel, climbing almost 17% to 159 million square feet as operators leaned into larger formats, rather than multiplying smaller sites.
Importantly, the industry added spaces faster than it added doors: The average coworking site size edged up a modest, but telling 1.2% year-over-year (Y-o-Y) increase, confirming that expansion has favored scale and consolidation versus fragmentation.
Coworking’s next chapter is portfolio discipline. The winners won’t be the ones with the most pins on a map, they’ll be the ones who can scale consistent occupancy and experience, trending towards larger footprints and the right submarkets to serve teams that are actually back in motion.
Sam Rosen, Director Coworking
Core markets also reinforced this shift. Manhattan, grew its location count by more than 15% Y-o-Y while maintaining an average footprint of roughly 41,600 square feet per site, up slightly from last year.
Elsewhere, markets such as Washington, D.C. and Los Angeles recorded double-digit gains in total locations while keeping average site sizes stable or growing. This demonstrates a national preference for fewer, more capable coworking hubs, as opposed to dense networks of small suburban offices.
Clearly, coworking expanded meaningfully, but with discipline, concentrating growth in markets and formats that can support long-term hybrid demand. Thus, as the industry heads into 2026, it does so not as a reactive alternative, but as a mature, scalable component of the U.S. office landscape.
Methodology
- To compile this report, we used proprietary data from CoworkingCafe to determine the number of coworking spaces per market, as well as the total square footage and leading operators.
- The study relied solely on the listing data available on CoworkingCafe as of December 2025.
- The top 50 markets analyzed were established by our sister company Yardi Matrix and were ranked based on allocated square footage.
- In terms of pricing, we looked at the national median starting prices per person per month for virtual office, monthly memberships (open workspace + dedicated desk), day passes (daily open desk coworking) and meeting rooms (hourly booking).
Fair Use & Redistribution
We encourage and freely grant you permission to reuse, host or repost the images in this article. When doing so, we only ask that you kindly attribute the authors by linking to CoworkingCafe.com or this page so that your readers can learn more about this project, the research behind it and


