
Given the constant evolution of remote and hybrid work models — as well as the ongoing changes in the commercial real estate sector — coworking has emerged as a dynamic industry that continues to shift and evolve across the nation. And, while the demand for flexible workspaces has given this industry a significant boost in recent years, it’s also the total share of space they cover and the leading operators in this market that are worth keeping an eye on.
With this in mind, we leveraged proprietary data from the third quarter of 2023 to break down the coworking landscape in the 25 largest U.S. markets and get a better understanding of the coworking sector’s current state and historic evolution. At the same time, we compared the most recent data with the state of the industry in Q2 of 2023.
National Coworking Supply Remains Consistent While Some Markets Reach 11% to 13% Growth Versus Last Quarter
The national coworking space inventory appears to have stabilized this quarter, with the total location count reaching 6,172 spaces, after registering an impressive 10% growth from Q1 to Q2 of 2023. The current location count represents a slight 0.15% increase from Q2, when the total number of coworking spaces stood at 6,163 nationwide.
Notably, about half of the top markets (13) registered decreases in their numbers of coworking spaces. Accordingly, the fact that only Manhattan marked a drop of more than 10% — while two markets (Raleigh-Durham and Phoenix) registered increases of 13% and 11% — helped balance the scale and keep the national supply slightly above the Q2 levels.
In some cases, the slight decline in the number of coworking spaces can be attributed to WeWork’s 17% drop among the top 25 markets. That’s because the popular operator’s portfolio has thinned in the last few months to go from 217 spaces in the top markets analyzed to 180, as well as drop by 16% nationwide.
“The WeWork reorg is causing some short-term contraction in the overall shared space square footage number, but demand is strong enough that the total number of national locations is up. We expect some volatility in total square footage to continue as those locations find their next use.” said Peter Kolaczynski, Director, CommercialEdge.
Rates for Open Workspaces & Dedicated Desks Stable, Virtual Offices More Affordable in Q3
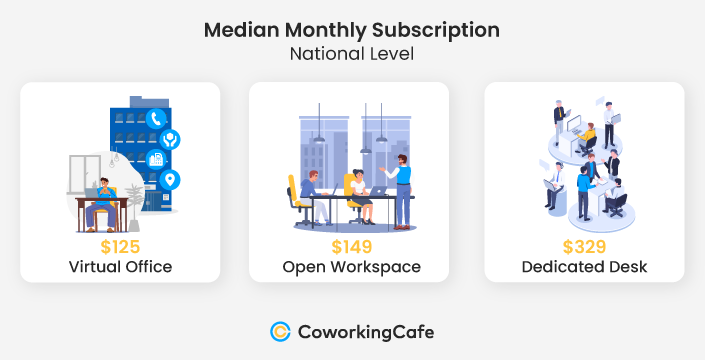
In terms of pricing, the national median rate for a virtual office in Q3 was $125, down by 12.5% in June, when it stood at $143. More precisely, Washington, D.C. registered the lowest median among all of the 25 top markets — only $80, which was exactly the same as in Q2.
In terms of virtual office subscriptions, Miami was the only other market to stand below $100 (at $99). At the other end of the spectrum, Chicago and New Jersey stood well above the national median: they were the only two markets to exceed the $200 mark at $205 each.
Meanwhile, in Q3, the national median membership price for open workspaces and dedicated desks stayed the same as in Q2, at $149 and $329, respectively. Even so, open workspaces are now most affordable in Phoenix; Orange County, CA, and New Jersey, where they landed below the national median, at $119. Conversely, for this type of coworking plan, the highest prices were registered in Brooklyn ($277) and Manhattan ($225). In both cases, they were significantly higher than the national rate of $149.
Additionally, the national median rate for dedicated desks stood unchanged, at $329 in Q3 of 2023. Again, the same two markets mentioned above (Manhattan and Brooklyn) also exceeded the national median for this type of coworking membership, reaching $529 and $455, respectively.
Leading Markets by Number of Coworking Spaces
Manhattan Registers Most Significant Drop in Coworking Supply, Still Leads with Highest Number of Spaces
While roughly half of the 25 markets registered slight decreases in their numbers of coworking spaces in Q3, Manhattan saw the most drastic drop with 11% fewer spaces (35 less than in Q2) for 270 total coworking spaces. This — paired with runner-up Los Angeles’ very slight 1% decrease in its number of spaces — helped significantly close the gap between the two coastal representatives, which were at a difference of 36 spaces in Q2. Now, LA is only behind Manhattan by three spaces.
Despite losing 10 coworking spaces in the last three months, Washington, D.C. still checked a solid number, with a total of 251. While back in June, Chicago was closely followed by Dallas-Fort Worth (DFW), the two markets have now switched positions. This is due to Chicago’s 2% drop in the number of coworking spaces and DFW’s 5% increase.
At the same time, the Raleigh-Durham, NC, market registered an impressive 13% growth this quarter — the highest among the top 25 markets — by going from 79 coworking spaces at the end of June to 89 in October. Similarly, an 11% increase in the number of coworking spaces was also registered in Phoenix, where the coworking inventory jumped from 104 spaces to 115 quarter-over-quarter. Not to be outdone, Seattle and Salt Lake City also each saw a 7% increase, eight and four spaces, respectively. Plus, Salt Lake City’s case was all the more impressive because this particular market only entered the top 25 in Q2 of 2023.
Leading Markets by Square Footage
Manhattan & New Jersey Lose Coworking Ground in Q3 With 11% Drop in Total Square Footage
Nationally, the coworking inventory decreased by 2% in terms of square footage. Yet, despite registering nine more spaces in Q3, the closure of larger ones is a possible explanation for this drop in numbers. Specifically, the total national square footage declined from 120 million in June to 117 million in October.
Naturally, the markets that registered losses in the number of coworking spaces also experienced a decrease in the total square footage covered by this type of real estate. And, in Manhattan and New Jersey, these drops were more prominent: both logged 11% less coworking square footage in Q3 as compared to Q2. Although the same percentage was lost in the number of coworking spaces in Manhattan, New Jersey saw a decrease of only 6% in the coworking inventory (nine spaces). This, paired with the loss in square footage, signals the closure of larger coworking spaces throughout the market. Likewise, other markets — like Washington, D.C. and Indianapolis — also witnessed notable declines in coworking square footage of 8% and 6%, respectively.
Conversely, Phoenix — which opened nine more coworking spaces in the last quarter — registered an impressive 8% growth in its total square footage covered by flex workspaces. Moreover, yet another location with remarkable growth in this category was San Francisco, where 7% more square footage was covered by coworking spaces in Q3 of 2023. As such, the market exceeded the 3-million mark in allocated square footage, going up from 2.9 million back in June.
As Opposed to Most Markets, Average Square Footage Grows in Brooklyn, Demonstrating Focus on Larger Coworking Spaces
Despite having the highest drop in the number of coworking spaces, Manhattan saw a slight increase of 0.3% in its average square footage in Q3. This put the market at more than 47,500 square feet in flex workspaces (which is more than double the national average of 19,000). Furthermore, the previous runner-up San Francisco was overtaken by Brooklyn, which followed Manhattan at a distance with almost 29,000 square feet in coworking spaces, which translated to a 5% improvement from Q2 and the highest increase among the top 25 markets.
Next, Chicago and Washington, D.C. kept their fourth and fifth positions, respectively, despite decreases in square footage of 2% and 4%. Then, New Jersey was yet another market to register a 5% drop in the overall surface covered by coworking spaces, which placed it at the very bottom of the 25 markets with 15,900 square feet.
Interestingly, Raleigh-Durham, NC — despite logging the highest growth in the number of coworking spaces in Q3 — saw a 6% decrease in the average square footage. That said, the market still finished above the national median in terms of average square footage, exceeding 21,000.
Given that the number of coworking spaces stayed roughly the same nationally while the total square footage occupied by these spaces decreased, the average coworking size in many markets has gone down, as well. To that end, during Q3, only seven of the top 25 markets increased their average square footage, while the other 18 registered decreases in this metric (therefore translating into smaller coworking spaces).
Distribution of Top Coworking Operators
WeWork’s Footprint Continues to Decline, But Industrious & Spaces Keep Expanding Their Portfolios
Industry giants Regus, WeWork, Industrious, Spaces and Premier Workspace remained the top operators with the highest numbers of coworking spaces at the national level, with all five logging more than 70% of their portfolios in the top 25 markets.
Industrious expanded its footprint in the third quarter of 2023 by logging four more spaces among the 25 markets analyzed (a 3% quarter-over-quarter increase). Even so, Spaces was more impressive: the coworking operator also added new locations to its portfolio covering the the top markets, with an increase of 4%.
Conversely, among the top 25 markets, Regus has seen a slight decrease of 3%. Similarly, Premier Workspaces registered a minor 1% drop as well. However, it was industry giant WeWork that lost the most ground in the last three months: the operator had 17% fewer coworking spaces in the top 25 markets in Q3 as compared to Q2 and also closed 16% of its nationwide inventory during the same timeframe.
Methodology
- To compile this report, we used proprietary data from CoworkingCafe to determine the number of coworking spaces per market, as well as the total square footage and the leading operators.
- The median coworking prices were extracted from CoworkingCafe listings and determined per person, per month.
- The study relied solely on the listing data available on CoworkingCafe as of October 2023.
- The top 25 markets analyzed were established per our sister company, Yardi Matrix.
- In terms of pricing, we looked at the national median starting prices per person per month for virtual office, open-workspace and dedicated-desk coworking subscriptions.
Fair Use & Redistribution
We encourage and freely grant you permission to reuse, host or repost the images in this article. When doing so, we only ask that you kindly attribute the authors by linking to CoworkingCafe.com or this page so that your readers can learn more about this project, the research behind it and its methodology.


