
More mothers in the U.S. are working today than at any point in the last decade, they are now significantly more likely than the average worker to do their jobs from home, and a record share are running their own businesses. By 2026, where mothers can build a career without burning out is a more pressing question than whether they’re in the workforce.
Quick Jump
A working mom’s day is a logistical performance, and the city she lives in is the stage. The childcare math, the commute, the work-from-home culture, the cost of living relative to the paycheck — these are the daily mechanics that decide whether a metro supports working motherhood or quietly grinds it down. To find out which U.S. metros give working moms the best shot, we analyzed metropolitan statistical areas with a population of at least 300,000 across three brackets — large (1M+), mid-sized (500K–1M), and small (300K–500K) — using a weighted scoring framework built around three pillars: Work, Education, and Health & Environment.
But before we get to the metros themselves, it’s worth setting the national baseline.
The National Picture: Working Motherhood in 2026
Of the roughly 33 million U.S. mothers with children under 18, roughly 74% are employed, and the trajectory is unambiguously upward: the rate has climbed in nearly every year since 2015, with a particularly sharp jump after 2021. Working moms now earn a median personal income of $49,400 — up from $45,000 just one year earlier — and 71% hold employer-based health insurance. The average working mom commutes 25.9 minutes each way and works 37.4 hours per week.
What’s most striking is how working moms have reshaped flexible work. Nationally, 16% of working mothers primarily work from home — meaningfully higher than the 13% rate for the total working population, and noticeably higher even than the 15% rate for working women overall. Self-employment among working moms has also climbed steadily, from 7% in 2014 to 9% in 2024. The metros that earn top rankings in this study are, by definition, the ones outperforming this baseline — sometimes dramatically.
Big Cities, Bigger Trade-offs: Minneapolis-St. Paul Leads Large Metros
In the 1M+ bracket, the top of the leaderboard skews Midwestern, with five of the top 10 metros sitting in the heart of the country. Metros that combine strong female labor force participation with moderate cost-of-living tend to outperform their coastal counterparts, even when those coastal metros pay better. Income alone, in other words, isn’t enough.
 The Twin Cities metro takes the crown among large markets, leading on the strength of an 84% moms employment ratio — a figure that reflects decades of female workforce participation woven into the region’s economic identity. Anchored by a corporate ecosystem that includes Target, 3M, U.S. Bank, General Mills and UnitedHealth, the metro has built out flexible-work infrastructure ahead of the curve, with nearly a quarter of working moms (25%) primarily working from home. Median income for working mothers reaches $60,000 and 77% carry employer-based health insurance.
The Twin Cities also stand out as family-friendly, with public school availability ranking 2nd in the large metro bracket and childcare consuming just 10% of median family income — among the more affordable ratios in the group. A median air quality index (AQI) of 44 places the region sixth-cleanest among large metros.

Denver lands in second with the strongest Work pillar score in the entire 1M+ bracket. More than a quarter of working moms here (27%) primarily work from home — the second-highest share among large metros — and another 11% are self-employed, a combined flexibility profile that’s the natural product of the region’s diversified post-tech economy.
Median income for working moms reaches $64,900, and the metro leads the entire study on coworking availability, with 9.4 spaces per 100,000 working-age residents — a direct reflection of how thoroughly the local commercial real estate market has reorganized itself around flexible and distributed work.
On the family-infrastructure side, pediatrician access runs at 124 per 100,000 children under 21 — solid if not standout for a metro of this scale — and the 26.1-minute average commute, while a touch longer than its Midwestern peers in the top five, still keeps daily logistics workable for parents juggling drop-offs and pickups.
 St. Louis rounds out the top three, anchored by an 80% moms employment ratio. Working mothers earn a median of $52,000 and 78% carry employer-based health insurance. The metro’s combination of a deep healthcare sector (BJC HealthCare, Mercy, SSM Health), an established financial-services base, and major Fortune 500 anchors like Edward Jones and Centene has produced a labor market where stable, benefits-rich employment is the norm.
The metro posts the bracket’s fifth-highest concentration of pediatricians and public school availability, at 156.7 per 100,000 children under 21 and 148 per 100.000 children, respectively. Childcare consumes 10% of median family income, among the most affordable ratios in the bracket, and the 25.3-minute average commute is genuinely manageable for a metro of this scale.
 Just behind St. Louis sits Kansas City, MO, where 78% of mothers are employed and median working-mom income reaches $52,000. Notably, 79% of working mothers carry employer-based health insurance, the strongest figures among the top five large metros.
The Education pillar tells an even stronger story: childcare costs consume just 8% of median family income — the third-most affordable ratio in the entire bracket. Pediatrician availability matches St. Louis at 156.7 per 100,000 children under 21, giving Kansas City families one of the deeper benches of pediatric care in the entire 1M+ bracket — a meaningful daily-life advantage in a country where many large metros run thinner.
The 22.6-minute average commute is among the shortest in the bracket, returning the equivalent of several workdays’ worth of time to working moms over the course of a year compared with peers in coastal metros. And the cost-of-living index of 92.5 makes this the sixth most affordable metro in the top five large markets, meaning the $52,000 median income stretches considerably further here than the same paycheck would in Minneapolis or Denver — the kind of purchasing-power edge that defines why Midwestern metros keep clustering at the top of these rankings.
 Omaha closes out the top five with the bracket’s highest Education pillar score — second nationally only to Memphis — driven by an unusually strong combination of childcare availability (946 providers per 100,000 children) and affordability (8% of median family income).
The local economy supports that infrastructure with a professional employment base anchored by Berkshire Hathaway, Mutual of Omaha, Union Pacific and a growing tech corridor, producing a 78% moms employment ratio. Working mothers earn a median of $52,000 and 77% carry employer-based health insurance. The 21-minute average commute is the second-shortest in the bracket, and the cost-of-living index of 91.9 makes this the most affordable metro in the top five.
Beyond the top five
Just outside the top tier, San Jose-Sunnyvale-Santa Clara takes sixth with a median working-mom income of $86,000 — the second-highest in the entire study — but its cost-of-living index of 110.4 takes a serious bite out of that figure. Boston, San Francisco and Columbus follow, each with their own trade-offs: Boston pairs strong employment numbers with one of the highest costs of living, while Columbus delivers more modest income figures alongside genuinely manageable expenses.
Mid-Sized Metros Steal the Show: Portland, ME Posts the Study’s Highest Score
The most interesting structural finding of the 2026 analysis: the No. 1 mid-sized metro outscored the No. 1 large metro by more than 10 points. The 500K–1M bracket isn’t a step-down category — it’s where some of the strongest fundamentals for working mothers are clustering, in cities small enough to feel navigable but large enough to offer real labor markets.
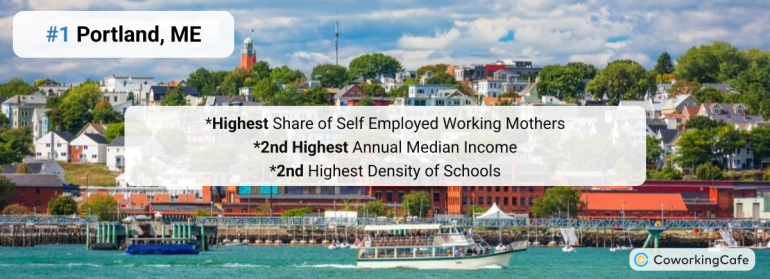 Maine’s Portland posts the highest overall score of any metro in the entire study — driven by exceptional performance across all three pillars rather than dominance in any single one. The moms employment ratio sits at 80%, with 22% of working mothers primarily working from home and 15% self-employed — the highest self-employment share among mid-sized metros and a direct reflection of how heavily the local economy now leans on remote-friendly professionals and small-business founders relocating from Boston, New York and beyond.
The compensation and family-infrastructure picture reinforces that strength. Median income reaches $60,000, and 76% of working moms hold employer-based health insurance. Childcare providers number 858 per 100,000 children, pediatrician access runs at 134 per 100,000 children under 21, and air quality lands among the cleanest in the bracket with a median AQI of 41. Coworking availability rounds out the profile at 6.2 spaces per 100,000 working-age residents — third-best in the bracket.
 Des Moines lands in second on the back of the country’s top Education pillar score. Childcare costs consume just 7% of median family income — nowhere in the study comes in lower — and the region offers 1,186 childcare providers per 100,000 children, placing it on the bracket’s podium for sheer volume. The metro pairs that infrastructure with a whopping 84% moms employment ratio, a figure no other metro in the study matches, rooted in Iowa’s longstanding tradition of high female labor force participation and supported by an unusually concentrated financial-services hub.
Principal Financial, Wellmark Blue Cross, Nationwide and a cluster of regional insurance carriers produce stable, benefits-rich professional employment, with 80% of working moms carrying employer-based health insurance — the strongest among the mid-sized bracket. Self-employment runs at 9.3%, the average commute is just 21.5 minutes, and the cost-of-living index of 91.7 makes Iowa’s capital one of the most affordable metros in the top tier of any bracket.
 New York’s capital region claims third on the strength of a top-three Health & Environment score and an 82% moms employment ratio. Moreover, median working-mom income reaches $66,000, a figure no other mid-sized metro matches, supported by state government employment, an established higher-education sector anchored by SUNY, and a growing healthcare network. What drives that Health & Environment score: 169 pediatricians per 100,000 children under 21 — outdone only by Worcester, MA, in this bracket — and a median AQI of 42. Additionally, the 23.7-minute average commute is reasonable, and 77% of working moms carry employer-based health insurance.
 Syracuse takes fourth, edged out only by one peer on Health & Environment across the mid-sized field. The 19.2-minute average commute is the shortest in the bracket, pediatrician access matches Albany at 169 per 100,000 children under 21, and the median AQI of 39 places Syracuse among the cleanest-air metros in its category.
The 80% moms employment ratio is supported by an economic base anchored in healthcare, higher education and emerging mid-tier tech employment, with 924 childcare providers per 100,000 children. Median income for working moms reaches $50,000, and the cost-of-living index of 95.7 keeps daily expenses below the national baseline.
 Ogden cracks the top five by leading the mid-sized field on the Work pillar — a score bested by just one metro across the entire study. The flexibility profile drives the ranking: 24% of working mothers primarily work from home and 12% are self-employed, both near the top of the bracket and reflecting Utah’s broader emergence as a remote-work destination. The 19.7-minute average commute is the third-shortest in the mid-sized rankings.
Median working-mom income lands at $43,000, on the lower end for a top-five entry, but childcare costs consume just 9% of median family income, and 80% of working mothers carry employer-based health insurance — an unusually strong number for a metro of this size.
Beyond the top five
Springfield, MO and New Haven, CT round out the next tier, with New Haven offering a $60,000 median income that mirrors the East Coast’s compensation premium. Spokane, Boise City and Worcester follow close behind. The pattern across the bracket is consistent: mid-sized metros tend to perform especially well on commute time, work-from-home flexibility, and self-employment — the metrics that translate most directly into day-to-day livability for parents.
Small Metros Punch Above Their Weight: Santa Rosa, Ann Arbor and Lansing Lead
In the 300K–500K bracket, the standouts tend to be university towns, capital cities, or specialized regional economies where professional jobs and family-friendly infrastructure have evolved together.
 Sonoma County’s metro tops the small-bracket rankings with the bracket’s highest Education score and the second-highest Health & Environment score. At a median AQI of 9, Santa Rosa has the cleanest air in the entire study — a meaningful daily-life advantage in a country where most metros land in the 30–60 range. The 81% moms employment ratio is the second-highest among small metros, with median income reaching $60,000 — supported by an influx of higher-earning remote professionals from the San Francisco Bay Area layered onto the region’s wine, hospitality and growing tech employment base.
Childcare infrastructure runs strong with 963 providers per 100,000 children, and pediatrician access lands at 116 per 100,000 children under 21. The cost-of-living index of 107.8 — the steepest of any small-metro top-five entry — is worth noting, with median home prices reflecting the region’s tight inventory and continued demand from outbound Bay Area movers.
 Ann Arbor takes second with the second strongest Work pillar score in the entire small-metro bracket. The 81% moms employment ratio places the metro firmly among the country’s most participatory, with 20% of working mothers primarily working from home and a median income of $61,000 — exceptional for a metro of this size and a direct product of the University of Michigan and Michigan Medicine’s pull on professional employment. 80% of working moms hold employer-based health insurance, childcare costs consume 10% of median family income, and Ann Arbor posts the bracket’s second-highest coworking density at 7.1 spaces per 100,000 working-age residents.
 Lansing rounds out the top three with an 80% moms employment ratio and the bracket’s third-strongest Education pillar score: 854 childcare providers per 100,000 children, with affordability at 10% of median family income.
The labor market is organized around state government, Michigan State University, and a regional healthcare network, producing a median working-mom income of $50,700 with 78% holding employer-based health insurance. The 20.8-minute average commute is meaningfully shorter than what working mothers face in larger metros. It’s a pattern that keeps showing up among the top small metros: state capitals with a big university tend to punch above their weight because public-sector and academic jobs come with hours and calendars that fit working-mom life better than most.
 Nebraska’s capital takes fourth with a 79% moms employment ratio and the bracket’s fourth-strongest Education pillar score. The Education numbers stand out: 1,185 childcare providers per 100,000 children — tied for third-most in the bracket — and affordability at 10% of median family income. The volume reflects a deep dual-earner labor market: roughly three-quarters of Nebraska children under six have every available caregiver in the workforce, well above the national rate, and the provider base has scaled to that demand.
The 18.4-minute average commute is the bracket’s third shortest, a daily margin that gives Lincoln working moms back the equivalent of an extra workday’s worth of time each month. Median income for working mothers reaches $46,400, and the cost-of-living index of 91.6 makes Lincoln one of the most affordable metros in the top tier of any bracket.
 Fort Collins closes out the top five with the highest coworking availability in the small metro bracket — 7.6 spaces per 100,000 working-age residents. For working moms balancing self-employment or hybrid arrangements, that density translates directly into options. Flexibility is what gets Fort Collins into the top five: 24% of working mothers primarily work from home — the highest share among the top five small metros — and 9% are self-employed, both driven by Fort Collins’s emergence as a Rocky Mountain destination for remote-friendly professionals priced out of Denver’s housing market.
The rest of the metrics hold up the entry rather than carrying it. Pediatrician access at 124 per 100,000 children under 21 is in line with the bracket average, and the 20.4-minute average commute keeps daily logistics workable. The $60,000 median income reflects the spillover of Front Range professional employment from Denver and Boulder — a paycheck that goes meaningfully further north of the metro line, where housing is cheaper than in either anchor city.
Beyond the top five
Past Fort Collins, Asheville, NC and Olympia, WA follow next, with Asheville’s exceptional 18% self-employment rate — the highest in the entire study — standing out as a marker of just how entrepreneurial its working-mom population is. Wilmington, NC and Trenton-Princeton, NJ round out the top 10, each with distinctive profiles — Wilmington leaning on a balanced mix of healthcare and education employment, Trenton-Princeton drawing on the corridor between Princeton’s research economy and Trenton’s state government employment.
Methodology
This analysis evaluates metro areas with populations of at least 300,000 and complete datasets across three key dimensions: Work, Education and Health & Environment. Each category includes weighted indicators drawn from federal, state, or verified third-party data sources.
Work Score: 50% of the total index
- Employment rate of moms: Share of women aged 20–64 with children under 18 who are employed out of the total number of moms in the metro [Census Bureau – ACS (2024 – metro level, direct)] – 15%
- Work-from-home rate among working moms: Share of working moms who primarily work from home [IPUMS USA (2024 – metro level, direct) Steven Ruggles, Sarah Flood, Matthew Sobek, Daniel Backman, Grace Cooper, Julia A. Rivera Drew, Stephanie Richards, Renae Rodgers, Jonathan Schroeder, and Kari C.W. Williams. IPUMS USA: Version 16.0 [dataset]. Minneapolis, MN: IPUMS, 2025. https://doi.org/10.18128/D010.V16.0] – 15%
- Median income of working moms: Annual personal income for working moms, in 2024 Inflation-Adjusted Dollars [IPUMS USA (2024 – metro level, direct)] – 15%
- Self-employment rate among working moms: Share of working moms who are self-employed [IPUMS USA (2024 – metro level, direct)] – 10%
- Commute time: Average one-way commute for working moms [IPUMS USA (2024 – metro level, indirect)] – 10%
- Weekly hours worked: Average weekly hours worked by employed moms [IPUMS USA (2024 – metro level, indirect)] – 10%
- Employer-based healthcare coverage: Share of working moms with health insurance through an employer or union [IPUMS USA (2024 – metro level, direct)] – 10%
- Cost of living: Regional Price Parity index (includes housing, goods, and services) [Bureau of Economic Analysis (2024 – metro level, indirect)] – 10%
- Coworking availability: Coworking spaces per 100,000 working-age residents [Yardi Research proprietary inventory as of April 1, 2026 – metro level] – 5%
Education & Childcare Score: 30% of the total index
- Childcare affordability: Median annual cost for one child in center-based and home-based care, adjusted for 2024 inflation; calculated as a share of median family income [U.S. Department of Labor (2022 prices, inflation-adjusted to 2024 – county level), Census Bureau – ACS (2024 – metro level)], indirect – 40% (reweighted)
- Childcare availability: Number of businesses with NAICS code Child Day Care Services per 100,000 children under 18 [Census Bureau County Business Patterns & Nonemployer Statistics (2023 – metro level, direct)] – 30% (reweighted)
- Public school access: Number of public schools per 100,000 children [National Center for Education Statistics (2024/25 – metro level, direct)] – 30% (reweighted)
Health & Environment Score: 20% of the total index
- Pediatrician availability: Number of pediatricians per 100,000 children ages 0–21 [America’s Health Rankings analysis of U.S. HHS, Centers for Medicare & Medicaid Services, National Plan and Provider Enumeration System, United Health Foundation, AmericasHealthRankings.org, accessed 2026 – state level, direct)] – 65%
- Air quality: Median Annual Air Quality Index [Environmental Protection Agency (2025 – metro level, indirect, data as of November 24, 2025)] – 35%
Additional Notes:
- Only metros with full data coverage across all metrics were included in the final ranking.
- Metric values were standardized using a min-max normalization approach, where the highest and lowest observed values within the dataset determined the score range.
- County-level or state-level data was used when metro-level estimates were unavailable.
- Inflation adjustments used the Consumer Price Index (CPI-U) for childcare-specific categories. Specifically, 2022 prices were adjusted to 2024 using BLS/DOL CPI-U annual averages for childcare (day care and preschool, U.S. city average), with a factor of 1.113.
- For Washington, DC, the pediatrician value corresponding to Virginia was used to maintain consistency with other metros. From a functional, economic, and social perspective, DC is closer to a city or urban core than to a state, and only ~10% of the metro’s population lives within DC itself. Using the VA value avoids the outlier effect of the DC-only figure.
- In this report, we have introduced adjustments to our data collection to enhance consistency over time. As a result, year-over-year comparisons have been excluded from this edition.


