
Yardi Matrix partnered with Smart Growth America and Places Platform, LLC to release the 2023 “Foot Traffic Ahead” report, which benchmarks the range of walkability in the 35 largest metropolitan regions in the U.S.
Key Takeaways:
- Walkable urbanism amounted to 1% to 7% of the land mass of U.S. metropolitan regions. The average among the 35 largest metros was only 1.2%.
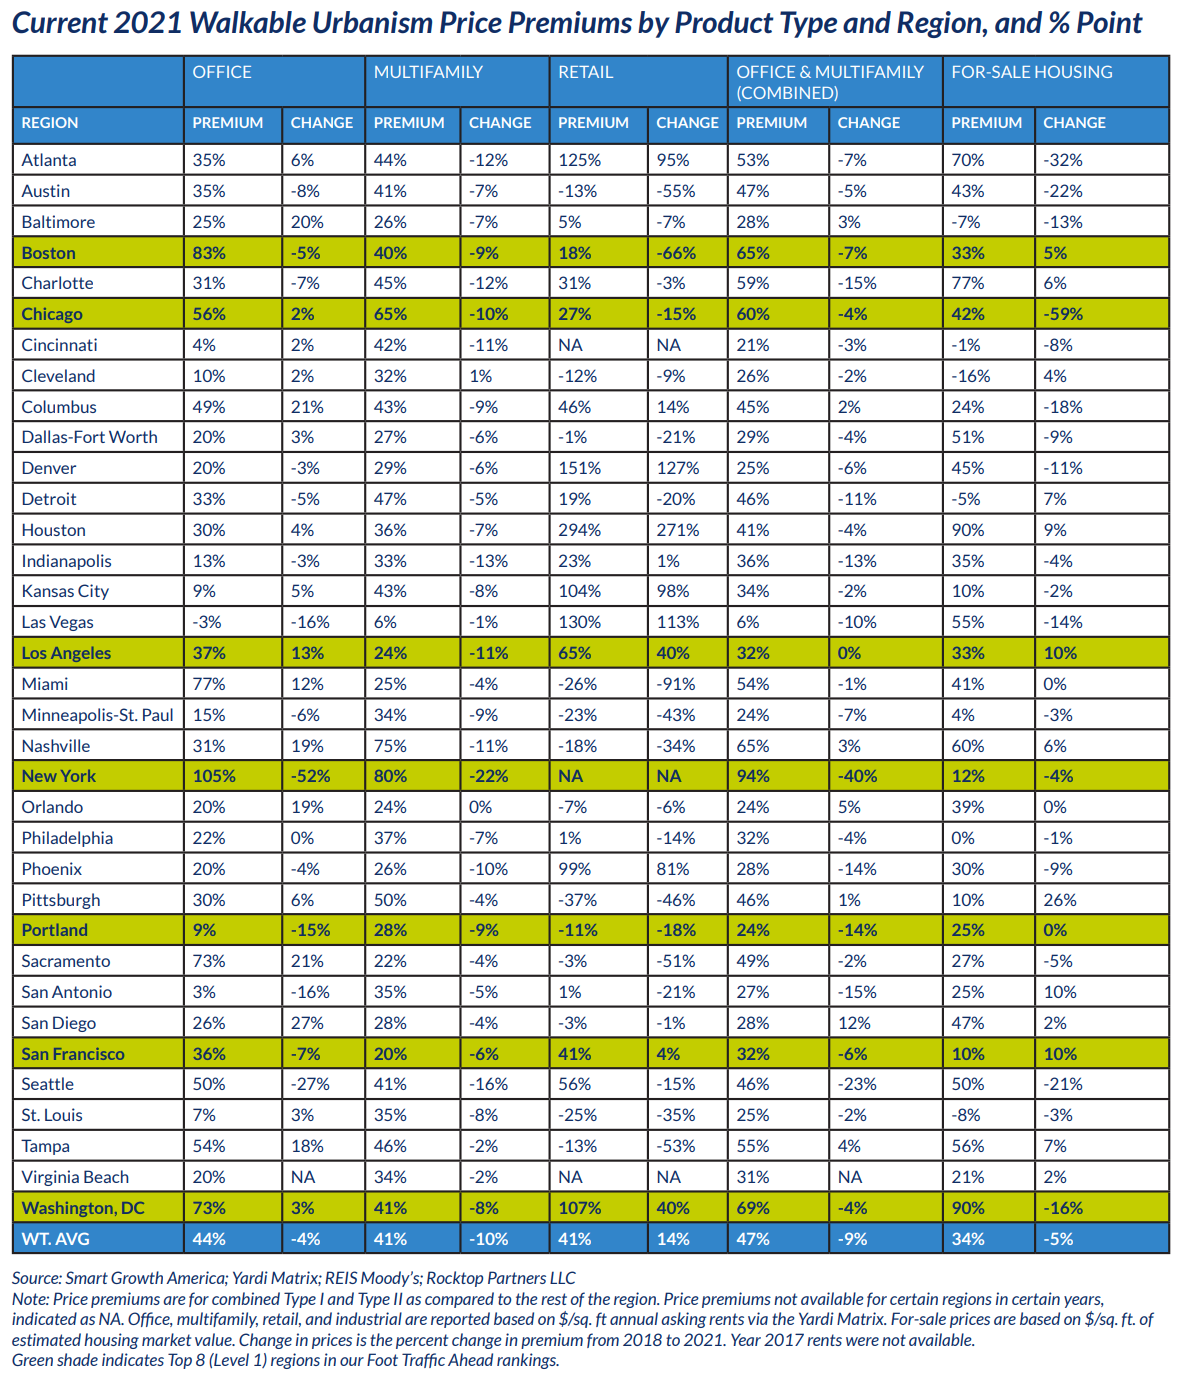
- Demand for walkable, well-connected real estate far exceeded supply: Price premiums for for-sale housing reached 34% and exceeded 40% for commercial properties in walkable urbanism.
- The economic effect of walkable urbanism’s headway is expected to be comparable to that of drivable suburbanism during the late 20th century, while also being more environmentally resilient.
- Policy reforms to deliver more mixed-use, mixed-income housing near transit are expected to take priority in the near future.
- New York, NY; Boston, MA; Washington, D.C.; Seattle, WA; Portland, OR; San Francisco, CA; Chicago, IL, and Los Angeles, CA scored highest in the Foot Traffic Ahead ranking.
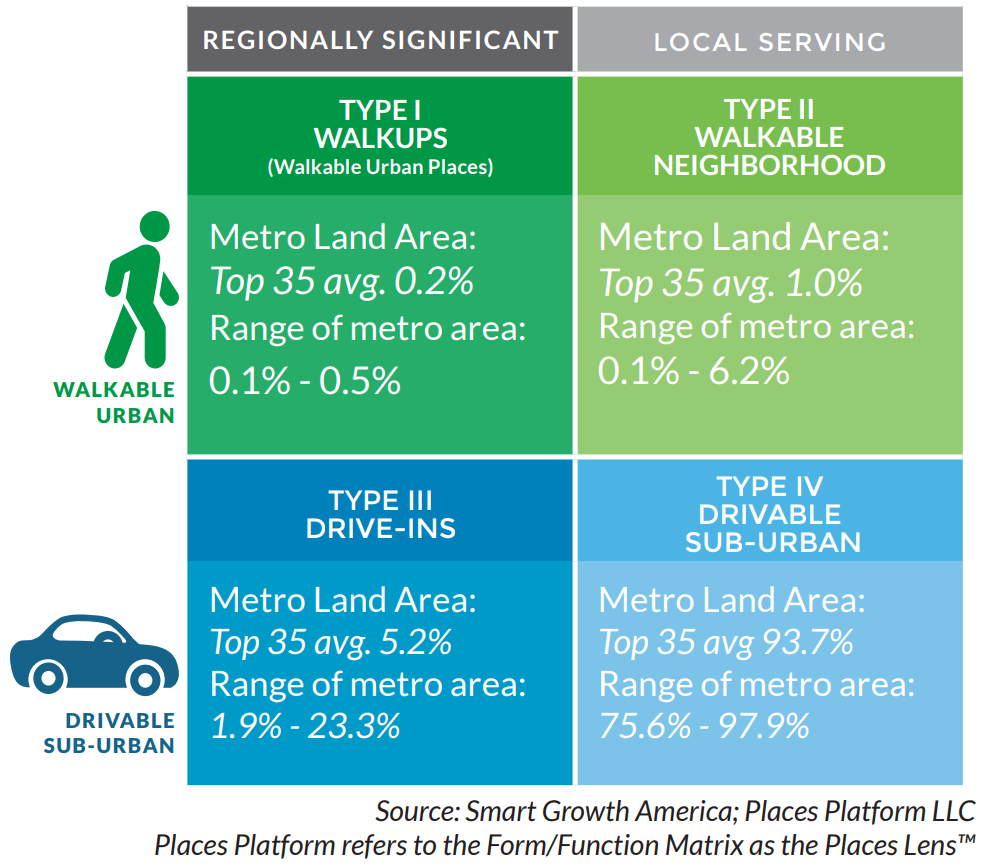 The Foot Traffic Ahead Index is the main metric at the base of the report. Specifically, it’s a measurement of the share of combined office, retail, multifamily, and for-sale housing that’s located in Type I or Type II walkable urbanism (see the Form/Function Matrix below) in the 35 largest U.S. metros. Notably, it weights commercial space more heavily than for-sale housing to accurately reflect the form and function of walkable urbanism.
Additionally, besides walkability (discussed as the form element), the report also classified two types of economic functions within metropolitan areas — regionally significant and local-serving: Regionally significant places drive wealth-creation by attracting industries with “base” or “export” jobs and generating about one-third of all jobs in the 35 largest metropolitan areas. Conversely, local-serving places are predominantly residential, with complementary commercial development. Jobs here tend to pay less and be dependent upon regionally significant jobs.
Why the Top 35 Metros Are Crucial to Understanding the Future of Walkable Urbanism
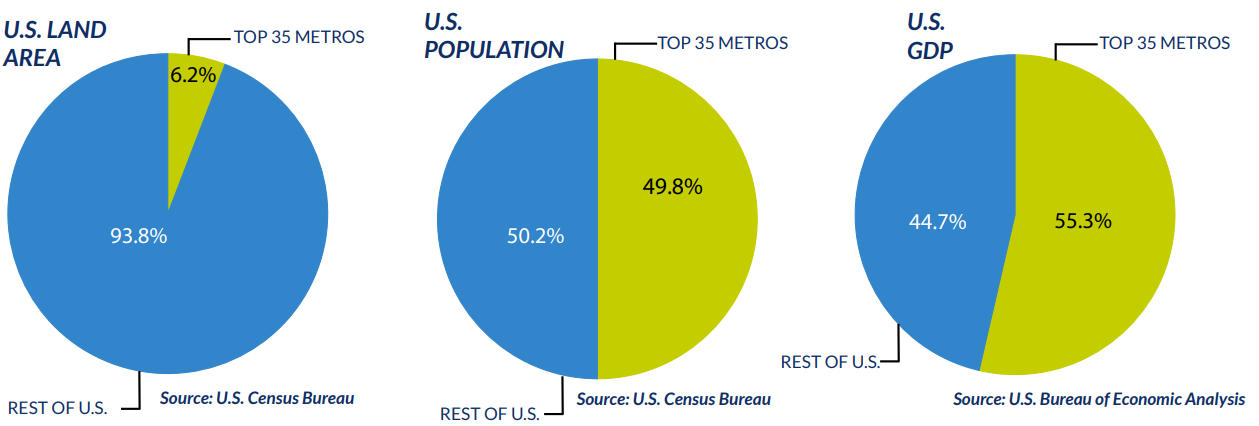
The 35 largest metropolitan areas in the U.S. housed 33% of the total population (165 million people) and accounted for 38% of the country’s real gross domestic product (GDP) in 2020, despite making up only 5.8% of the land area. Similarly, walkable urbanism within these metros accounted for just 1.2% of the land area, but contributed a significant 19.1% of the U.S. real GDP and housed 6.8% of the residential population.
These findings emphasize the critical role that walkable urbanism plays in each metropolitan region and for the nation as a whole, especially in the context of today’s housing access crisis.
 Ranking Walkable Urbanism in America’s Largest Metros
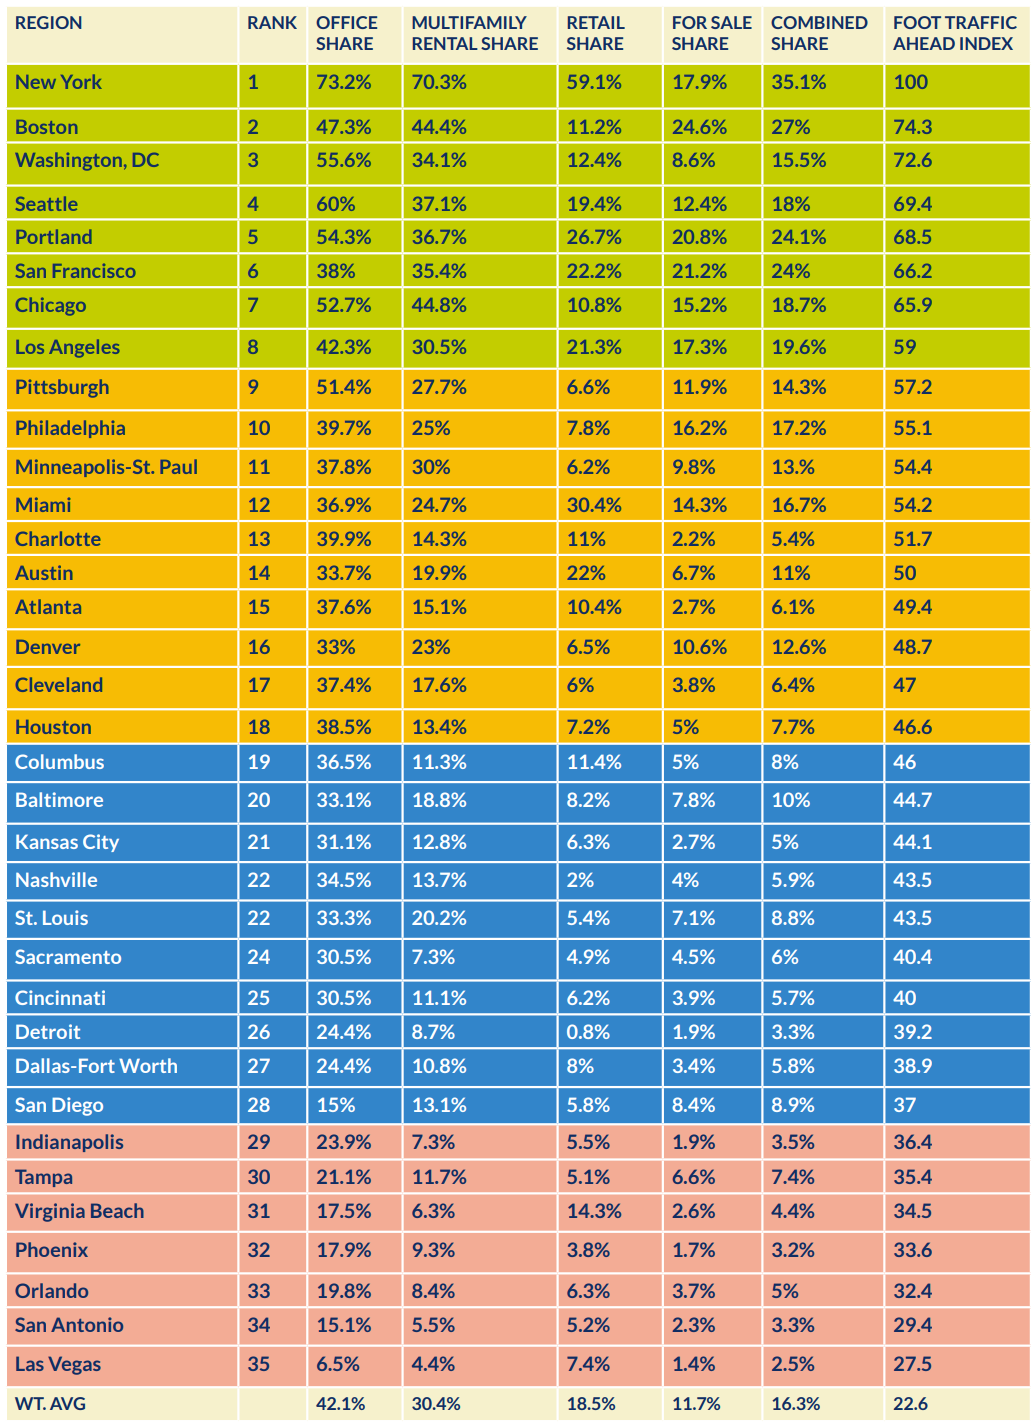
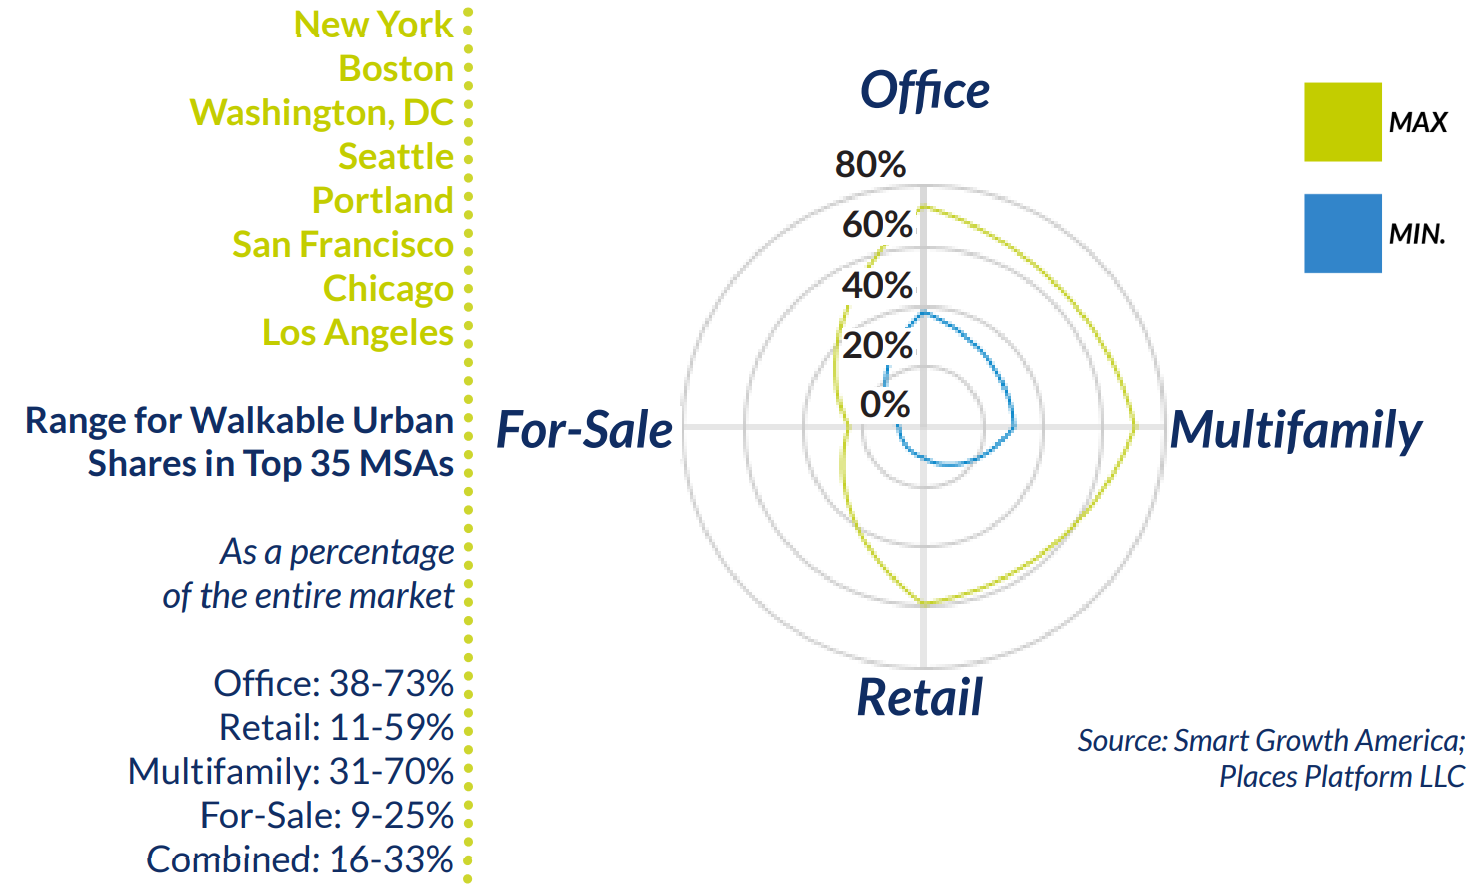
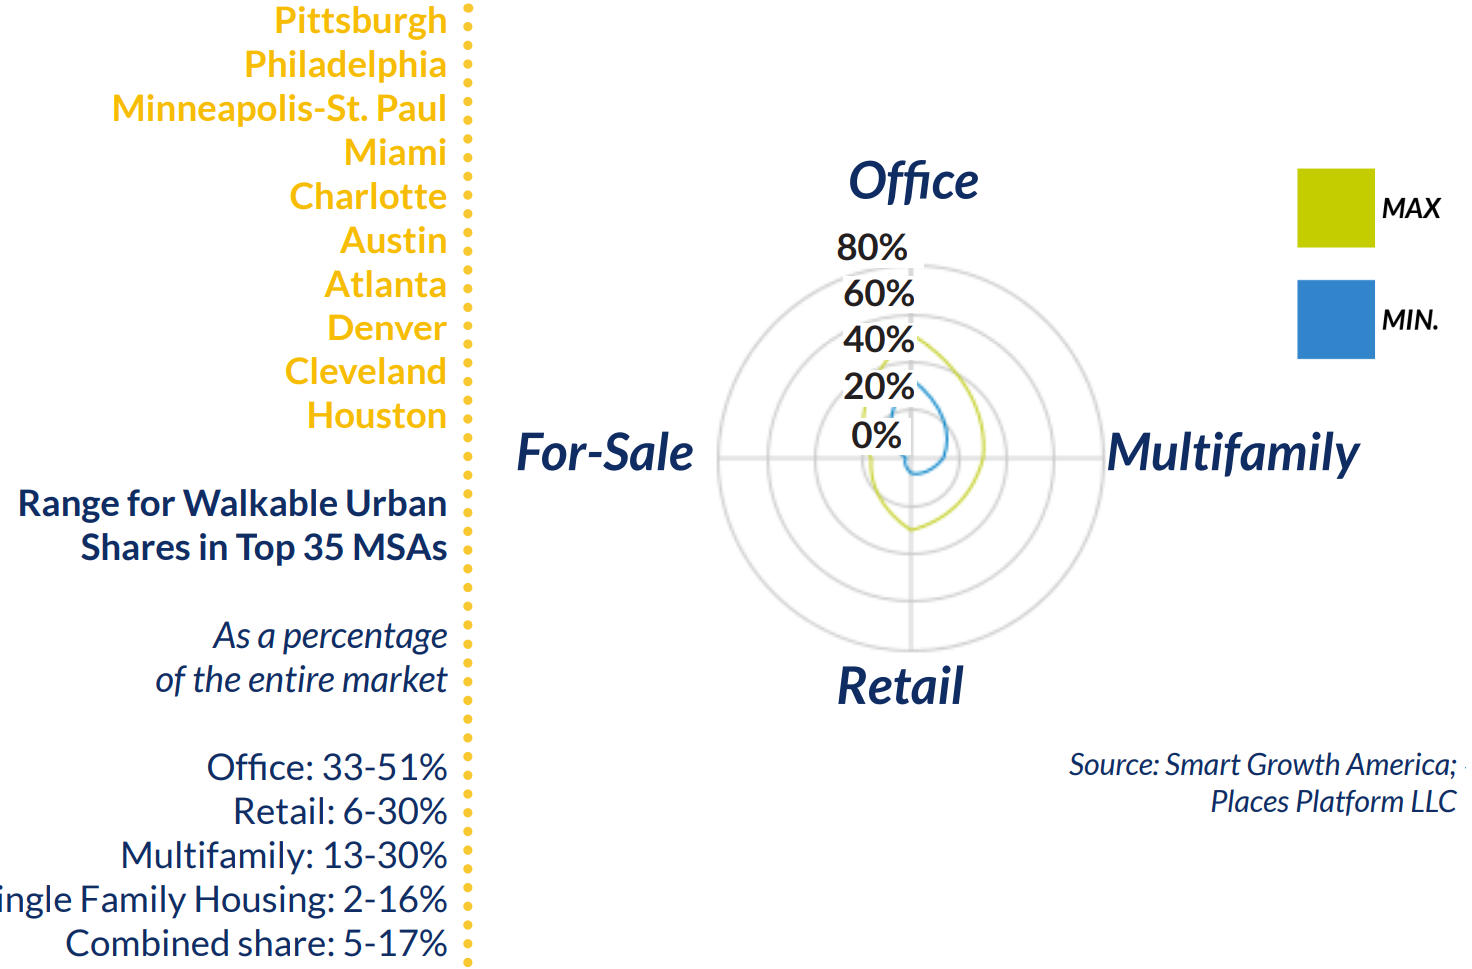
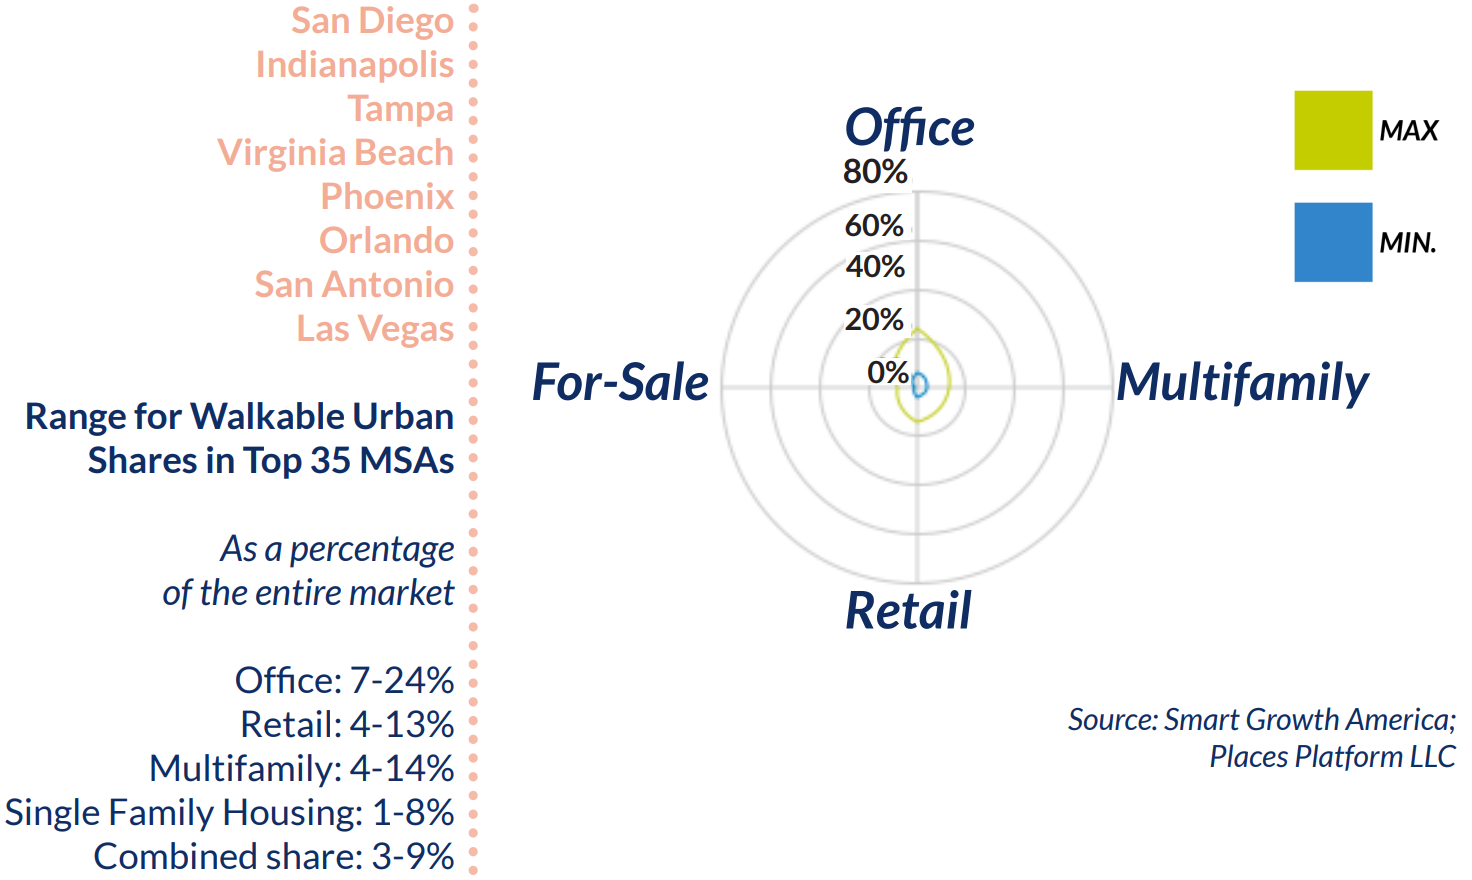
About 16% of all office, multifamily rental housing, retail, and for-sale housing across the 35 metros identified was in walkable urban places. However, these different product types were present in significantly different proportions. For instance, “office” had the highest concentration in walkable urban places by far: 42% of all offices in the 35 largest metro areas were in walkable urban places. It was followed by multi-family rental (30%), retail (19%) and for-sale residential (12%).
In fact, the majority of office space was in walkable areas in six of the top 10 cities with New York leading at 73%. Following the Big Apple were Seattle; Washington, D.C.; Portland, Ore.; Chicago; and Pittsburgh. Likewise, walkable urban places also had a high concentration of multifamily rental housing with New York City again at the top of the list with 70% of its inventory in such areas.
Retail space, on the other hand, was more dispersed — only New York (59%) and Miami (30%) stood out. And, as you might expect, for-sale housing had the lowest concentration in walkable urban places, reflecting 20th-century suburban development patterns and zoning restrictions. In this case, Boston led in walkable urban housing with 24% of its for-sale housing stock in walkable urban places. This was due to a high percentage of pre-WWII homes that were constructed during a time when walkable urban development was the norm.
 Level 1: Highest Walkable Urbanism
Many of the cities that ranked highly on the list have extensive, historic railway systems and a tradition of densely populated urban areas dating back prior to 1940 — a time when walkable urbanism was the standard mode of development.
 What’s more, with the exception of Chicago, the top walkable urban metros were largely coastal markets driven by knowledge economy industries and with high transit ridership in cities such as Boston, MA; Washington, D.C.; Chicago, IL and San Francisco, CA.
Level 2: Upper-Middle Walkable Urbanism
Meanwhile, many areas in the second grouping within the rankings were reemerging as walkable neighborhoods. Here, modern commercial amenities are increasingly occupying buildings that were initially developed along a similar concept, but had been converted to other uses as walkable retail faded during the late 20th century.
 More precisely, Pittsburgh and Philadelphia were closely ranked with a mix of Type I WalkUps — such as urban universities — and Type II Walkable Neighborhoods from the late 19th and early 20th centuries. Alternatively, Denver, CO and Minneapolis-St. Paul, MN have both built and expanded rail transit, thereby attracting a highly educated workforce.
Level 3: Lower-Middle Walkable Urbanism
Level 3 was split between Sunbelt metros attempting to resurrect walkable urbanism for the first time in generations and Midwest metros reconfiguring their historically industrial economies by revamping walkable urban locations.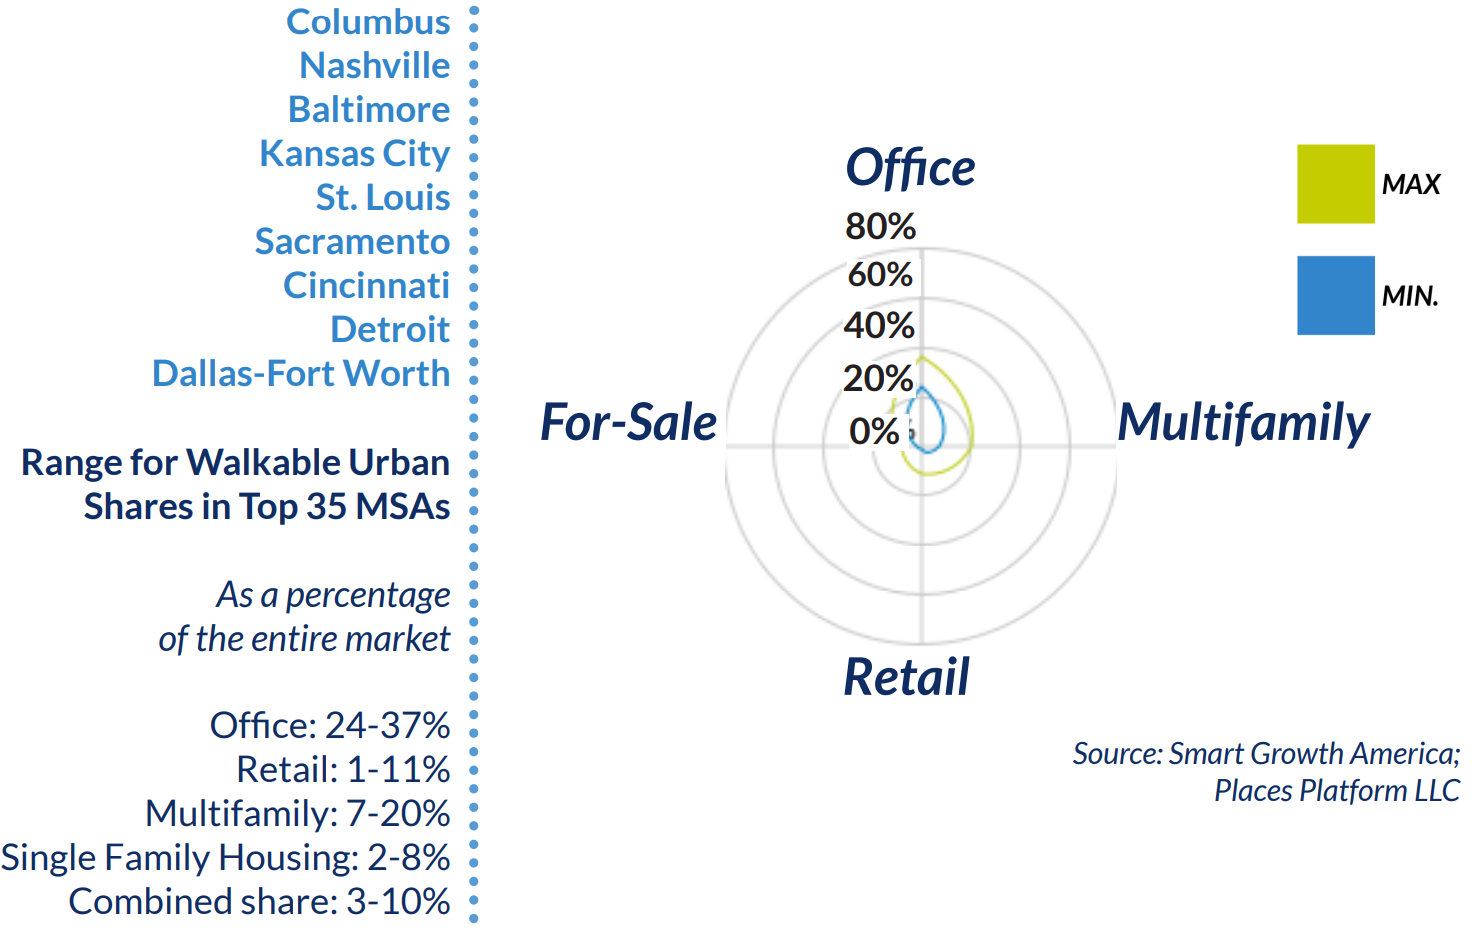 However, the restricted rail service in the post-industrial metropolises of Columbus, OH Baltimore, MD; Kansas City, MO; St. Louis, MO; Cincinnati, OH; and Detroit, MI hindered the expansion of walkable urbanism. Even so, the Columbus metro placed highest in this level due to its knowledge-based economy gravitating around The Ohio State University and the state capital.
Level 4: Lowest Walkable Urbanism
Finally, Level 4 included primarily Sunbelt metros, although Indianapolis, IN was an exception. Here, the downtown-adjacent Near Northside and Near Southside neighborhoods — as well as several urban business areas — have seen revitalization. In particular, the reconstruction of Carmel, IN (a suburban town center that stands as a universal example of an urbanizing suburb), was the surprise in this metro.
 Additionally, Las Vegas was a distinctive metro area that ranked last on the Foot Traffic Ahead Index. In Sin City, the only area with a high density of walkable urbanism was along The Strip. Yet, although walkable urbanism was limited to the central area, both the Arts District and downtown were revitalizing and enabling new walkable projects, like the Zappos headquarters.
Social Equity & Price Premiums — Walkability’s Effect in the Wider Social & Financial Context
Granted, exclusionary policies and practices in zoning, lending, and land use have perpetuated segregation and limited wealth-building opportunities for communities of color in the U.S. Thus, the price premiums in walkable urban areas — while a positive sign of demand from a market perspective — nevertheless present equity concerns as they further disadvantage marginalized households that have been affected by past discriminatory land use policies.
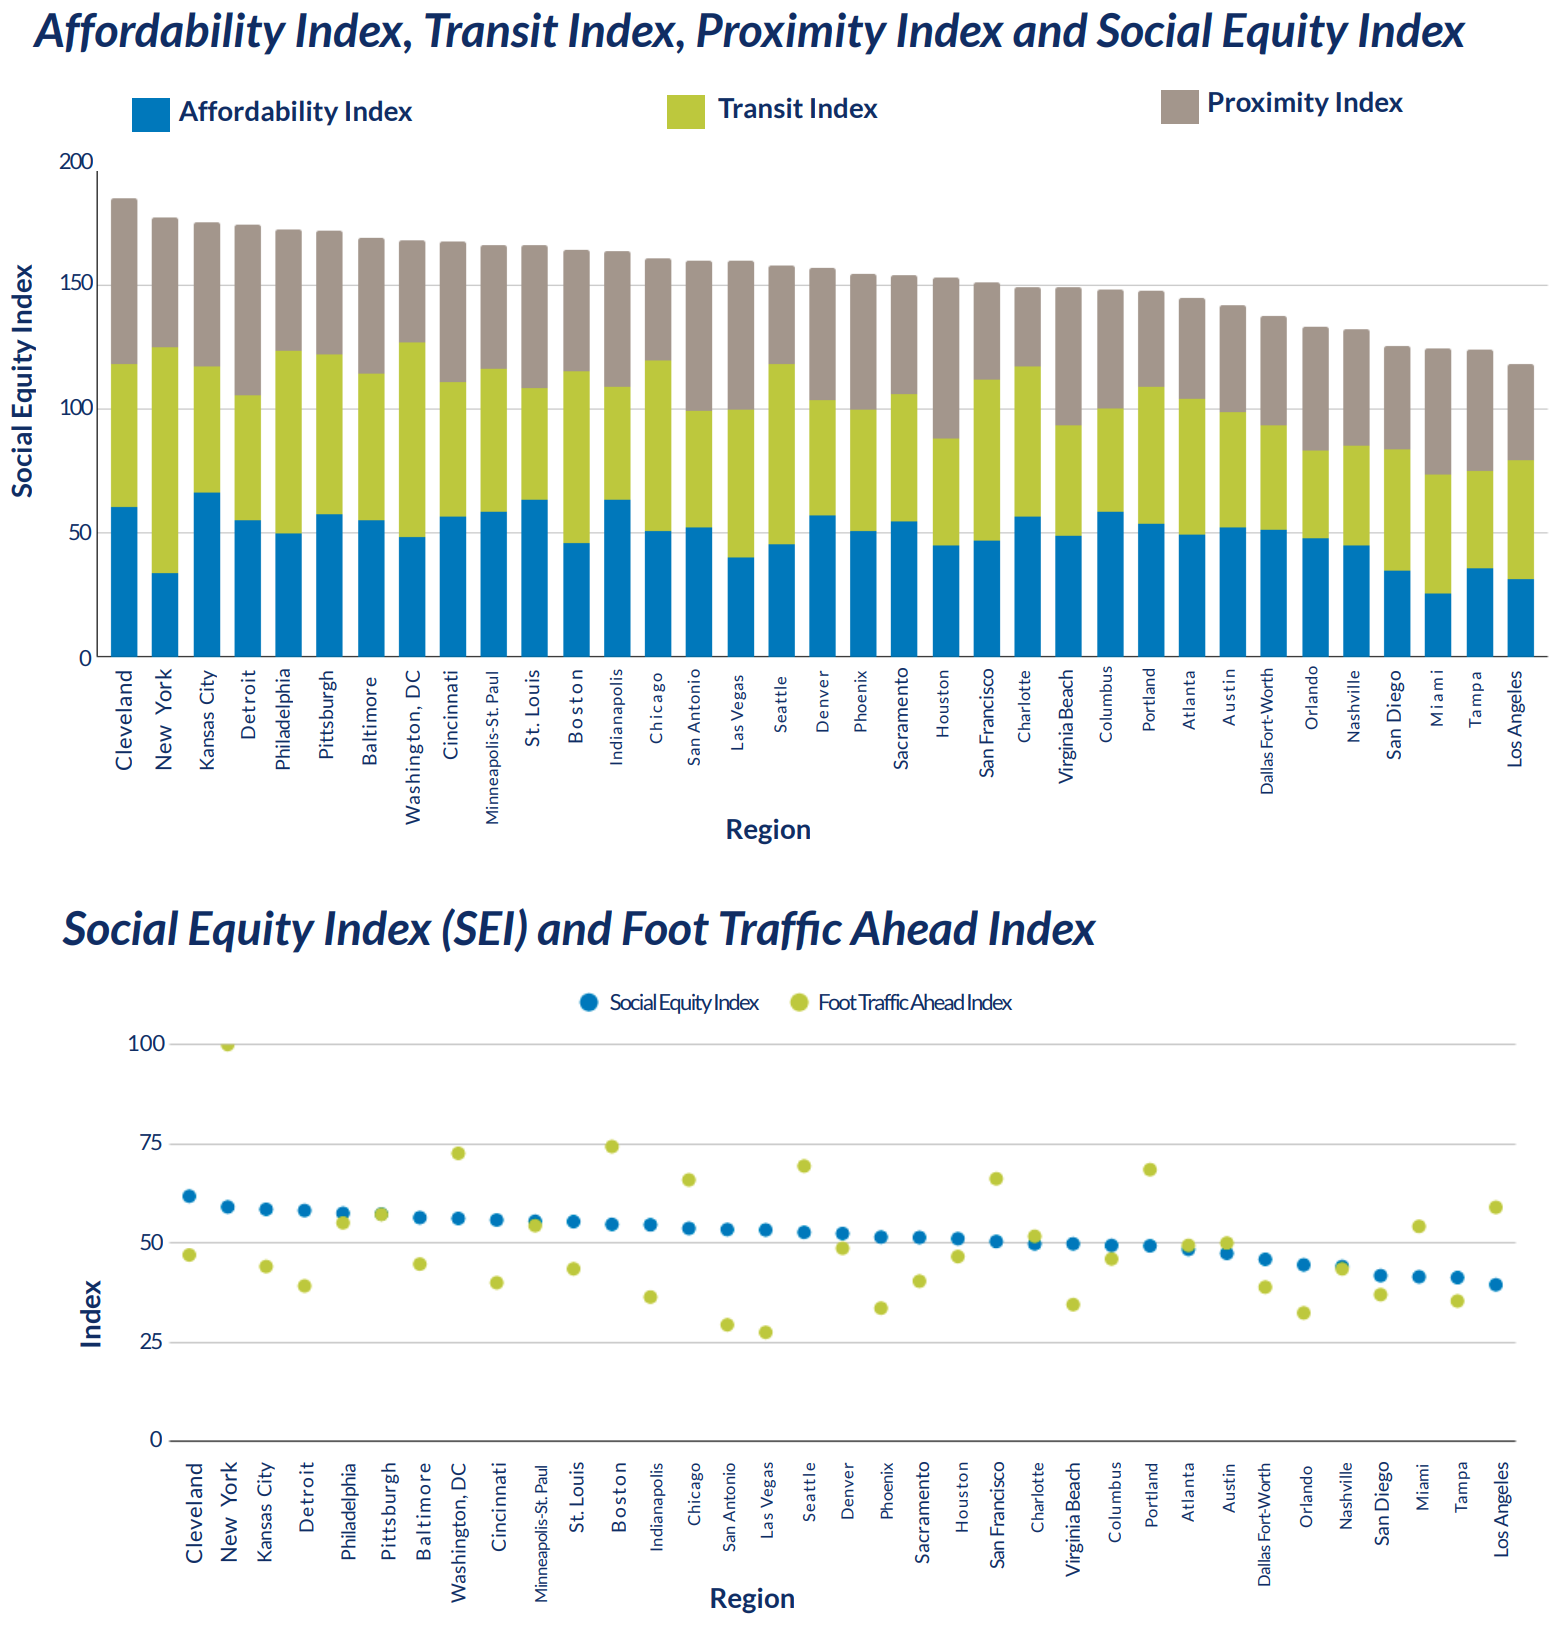 So, as an additional layer to the Foot Traffic Ahead Index, the report introduced the Social Equity Index (SEI). Namely, it ranked metropolitan areas by the affordability of and access to well-located housing and services; transit quality; and distance to walkability for different socioeconomic groups. Consequently, the index was the average of scores from 0 to 100 that were assigned to each metropolitan area based on the following:
- Affordability: “How affordable is it to live in walkable urbanism?”
- Transit: “What is the quality of transit access to walkable urbanism so that people don’t have to spend more money on cars and auto upkeep?”
- Proximity: “How far do people from different socioeconomic and racial groups have to travel to get to walkable urbanism?”
To that end, cities like Cleveland, OH; Kansas City, MO; Detroit, MI; Pittsburgh, PA and Baltimore, MD ranked high on the SEI due to their affordable or easily accessible walkable areas without a car. These cities also had high scores on the Proximity Index, which means that walkability was not as segregated among different socioeconomic and racial groups, thereby allowing historically marginalized groups to have easier access to walkability. At the same time, expensive regions with well-connected transit systems — such as New York City, NY, Philadelphia, PA; Washington, D.C.; and Boston, MA — also ranked high on the SEI.
From a market perspective, the demand for walkability was clearly shown by the price premiums — the difference in value between walkable and non-walkable properties. While the discrepancy appeared in every region for both office and multifamily products, it has also shrunk (to some degree) in 26 of 35 markets since 2018. And, as for the for-sale housing market, the gap closed in only six cities by 2021 (Baltimore, MD; Cincinnati, OH; Cleveland, OH; Detroit, MI; Philadelphia, PA and St. Louis, MO). It’s worth noting here that all of these markets are post-industrial cities with actively developing housing markets in and around their walkable neighborhoods.
 “Foot Traffic Ahead 2023” highlights the ongoing demand for walkable urban real estate across the largest 35 metropolitan areas in the U.S. Specifically, the report emphasizes the growing trend shaping the future of real estate development, as well as the pressing importance of reviewing land use policies to protect and improve affordability in well-connected, mixed-use areas — especially in the context of the current housing access crisis.
The report also concluded that walkable urban areas were poised to become just as economically prosperous in the 21st century as drivable suburban areas were in the 20th century. Moreover, walkable urbanism provides a more sustainable and environmentally resilient lifestyle with increased quality of life and economic opportunities for low-income households, all without the need for car ownership.
Read the full report
For further angles, metrics, case studies and the detailed methodology, download the complete Foot Traffic Ahead 2023 report.
Additional notes:
- Data sources included partner databases provided by Yardi Matrix; Places Platform, LLC; Rocktop Partners, LLC; and the American Enterprise Institute Housing Center; commercial data from REIS Moody’s; as well as government data from the U.S. Census Bureau, the U.S. EPA Smart Location Database and the U.S. Bureau of Economic Analysis.
- The Foot Traffic Ahead series does not account for owner-user commercial space (real estate that is owned and occupied by a business, government institution or nonprofit organization) and may not accurately reflect the entire U.S. commercial real estate market (estimated to be potentially 30% to 40% owner-user space), as there is no national database for this type of space.


