
It’s easy to think that a balanced diet and regular exercise are all you need to stay healthy. Yet, while these factors can greatly influence overall wellness, the Global Wellness Institution shows us that alongside personal lifestyle choices, environmental and socioeconomic factors can account for 80% to 90% of our disease risks and health outcomes.
With that in mind, this study analyzes 66 U.S. cities across 10 different health-related metrics and establishes the cities that offer residents the best conditions for a healthy lifestyle. As we’ll see below, different cities can assist residents in different ways. For instance, some provide infrastructure that encourages walking, biking and other outdoor activities. Others promote mental and physical health awareness through extensive insurance coverage and a wide range of mental support practices. For the full list of metrics and their explanations, jump to the methodology section.
Here is how some U.S. locations help people live a more balanced life:
- Minneapolis ranks best among the 66 cities analyzed due to great health insurance coverage, good biking conditions and high park availability.
- Runner-up Portland, OR stands out with fantastic scores in air and life quality and peak bikability.
- Miami boasts the highest number of fitness centers per 100,000 residents and density of grocery stores, supermarkets and specialty stores.
- Lincoln, NE, offers the highest quality of life, along with excellent health care coverage, low living costs, and minimal pollution.
- With an average air quality index of 33 (out of 50), residents in Anchorage, AK breathe the cleanest air.
Regional Highlights: Midwest, Sun Belt & Pacific Northwest Dominate Top Spots for Healthy Lifestyles
Leading the way in healthy living, Minneapolis claims the top spot, joined in the top 10 by fellow Midwestern cities Lincoln, NE; St. Louis, MO; and Madison, WI. The region owes its success in promoting healthy habits to a deep interest in both physical and mental wellness. With high densities of both sports establishments and stores with fresh produce, residents of these cities have an easier time exercising and eating healthy. Moreover, the abundance of mental health practitioners reflects the community’s awareness and demand for mental well-being, thereby ensuring a holistic approach to health.
The South and West are also well-represented with three entries each in our top 10. Notably, all of the top spots in the South stand out in their own ways. For example, Miami provides the widest selection of healthy food options for residents, while Arlington, VA, impresses with its vast variety of parks. And, venturing out West, we can see that the outdoors play an important role. Specifically, the high walk and bike scores in cities like Portland, OR, and San Francisco suggest a strong focus on pedestrian-friendly infrastructure, which enables residents to stay active and forgo driving — at least for shorter trips.
Healthy Living, City-Style: America’s Most Health-Focused Cities & What They’re Doing Right
 Minneapolis leads the nation with strong scores across multiple health-related metrics. The city ranks sixth for sports establishment density, offering over 64 fitness centers per 100,000 residents—ideal for staying active even in colder months. Eating well is also within reach thanks to 60 grocery stores, supermarkets, and specialty food shops per 100,000 residents.
The city leads the nation with the highest bike score, reflecting exceptional biking conditions, including 16 miles of protected bikeways, 98 miles of bike lanes, and 101 miles of off-street trails. It also ranks second for park accessibility, with 298 parks placing green space within a 10-minute walk for most locals.
 Portland stands out due to its particularly clean air, coming in second only to Anchorage, Alaska, in terms of air quality — a tough benchmark to beat for any large city. The famed Rose City took pragmatic steps to reduce air toxins, especially those produced by vehicles, through programs like the Vehicle Inspection Program and the Oregon Low Emission Vehicles Program.
Portland has the second-best bike score, as well. Here, local government initiatives — such as the BIKETOWN bike share system or the Portland By Cycle program — make cycling an appealing alternative to gyms and other indoor fitness establishments by offering guided bike rides and biking classes.
Plus, with 333 parks breathing life and oxygen into the city and inviting residents to stretch, jog, or unwind, Portland makes outdoor fitness easy and fun. And, when the weather isn’t cooperating, the city’s density of almost 40 fitness centers per 100,000 residents will save the day.
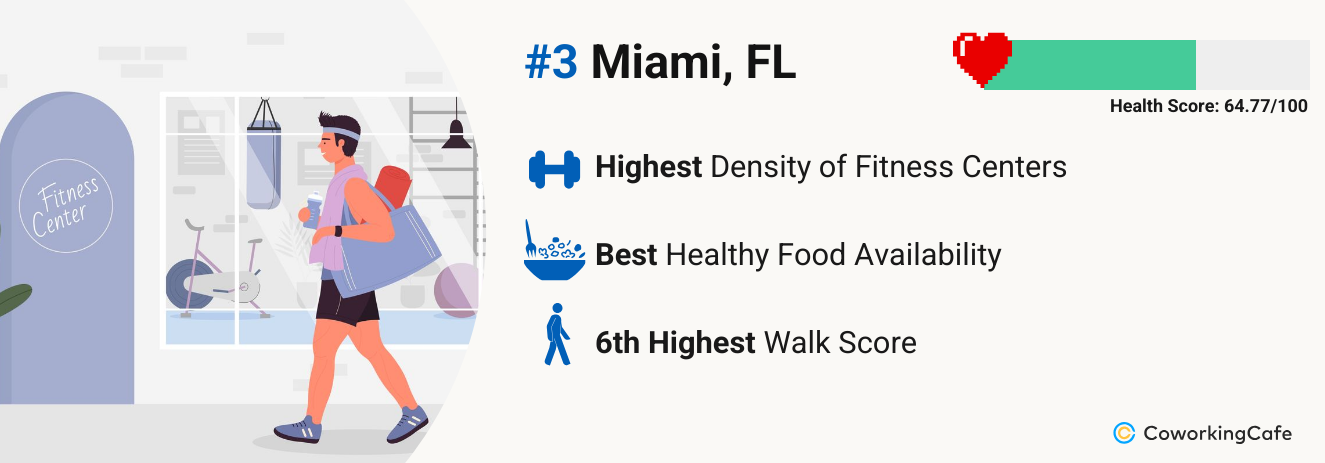 For residents in Miami, having a well-balanced diet is more attainable than it is in other cities. That’s because it has the highest density of grocery stores, supermarkets and specialty stores, which translates to 129 healthy purchase opportunities per 100,000 citizens. The high variety in grocery stores and supermarkets encourages people to develop healthy dietary patterns, which, in turn, help lower the risk of chronic diseases.
Miami also makes exercising easy by boasting the highest density of fitness centers and sports institutions, which amount to almost 95 establishments per 100,000 residents. While indoor gyms are one way to get your daily dose of exercise, Miami’s outdoor wellness culture serves residents and travelers alike through plenty of various sports activities, including beach yoga, surfing or cycling via the Citi Bike rental program.
 Coming in first in the quality-of-life index, Lincoln offers favorable living conditions facilitated by affordable rents, a low unemployment rate and a 93% health insurance coverage rate. Additionally, there is a high interest in mental wellness, as Lincoln has the ninth highest density of mental health practitioners — here, people have access to almost 21 mental health-focused offices per 100,000 residents.
Lincoln boasts some of the cleanest air in the country, and it’s no surprise—with more than 6,000 acres of parks and natural areas, the city ranks fourth for air quality. But nature isn’t doing all the work: local leaders are cutting emissions by investing in renewable energy, switching to electric buses, and enhancing air-quality monitoring efforts.
 The saying ‘a healthy mind in a healthy body’ rings especially true in Seattle, where residents prioritize both emotional well-being and physical health. To that end, the city has the highest density of offices that provide mental health services (40 practices per 100,000 residents), which means that Seattleites have the possibility to access services that are within their budget in a timely manner.
The city also offers plenty of ways to stay fit while relaxing and having fun. Namely, people can stay in shape by strolling through one of the city’s 381 parks, biking on one of Seattle’s multi-use trails or visiting one of the 97 fitness centers sprinkled throughout the city.
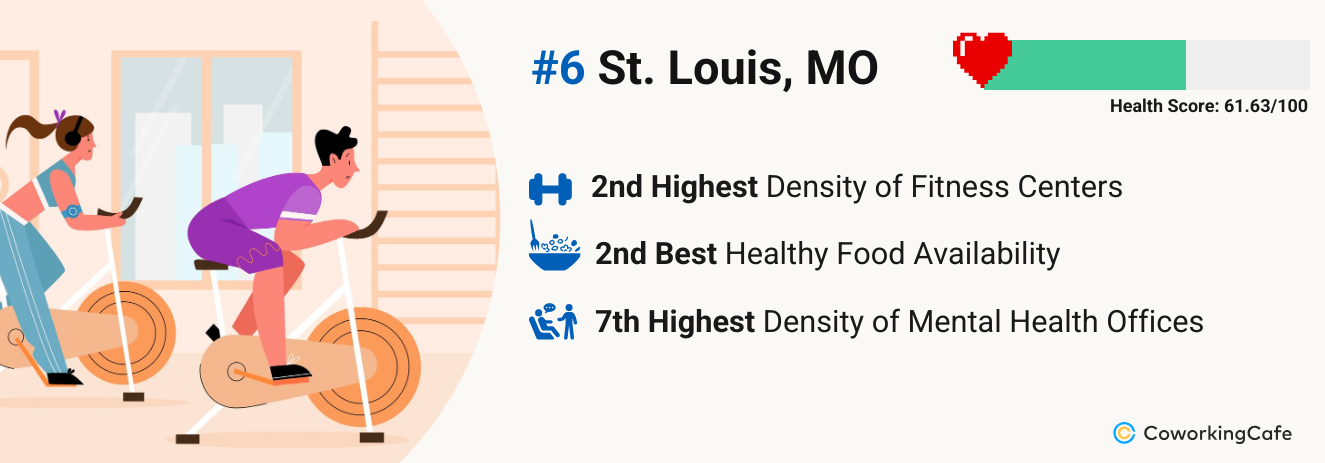 Boasting the second-highest density of sports establishments, St. Louis residents have access to a little more than 80 fitness and sports centers per 100,000 citizens. Besides gyms, River City provides 26 golf courses, 165 miles of biking trails and 362 parks, five of which come with tennis and pickleball courts as the latter has gained in popularity in the city in recent years.
Establishing healthy eating habits might also come easier in St. Louis because locals have the second-highest density of healthy food shopping opportunities with 72 grocery stores, supermarkets and specialty stores per 100,000 citizens.
Additionally, the high density in mental health-focused practices further reinforces the city’s dedication to providing a well-rounded environment where both physical and mental health are important.
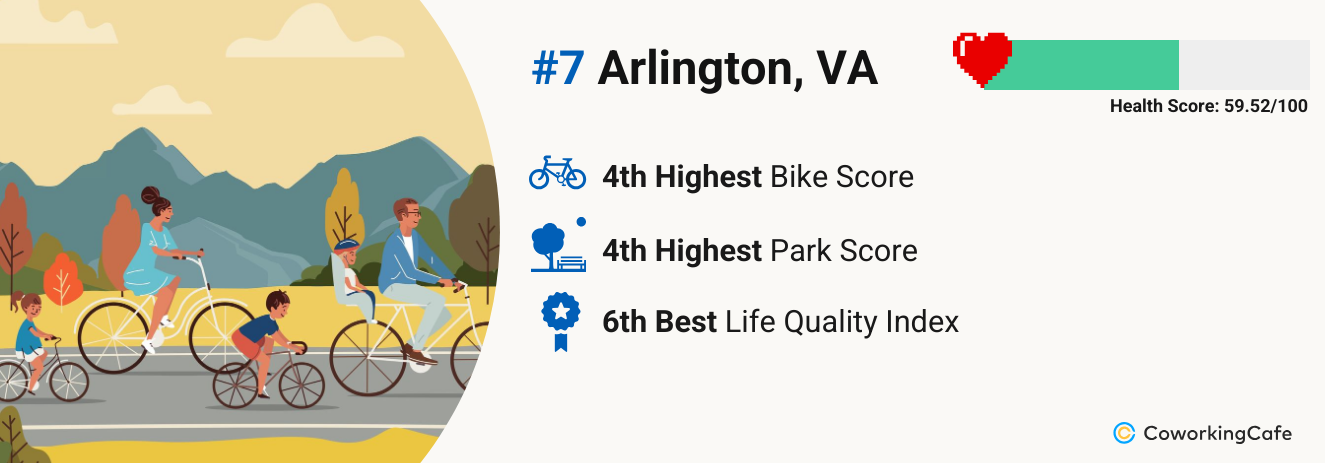 The quality of life in Arlington is among the best in the country. Besides the fact that almost 95% of residents have health insurance, the city also has low pollution levels, good safety rates, and a relatively low property price to income ratio.
Arlington also shows a strong performance when it comes to parks and cycling infrastructure. It ranks fourth for park access and quality, thanks to its high density of green spaces, walkable layouts, and substantial investment in park improvements. The city also excels in bikeability, holding the fourth-best bike score and earning gold-level recognition from the League of American Bicyclists.
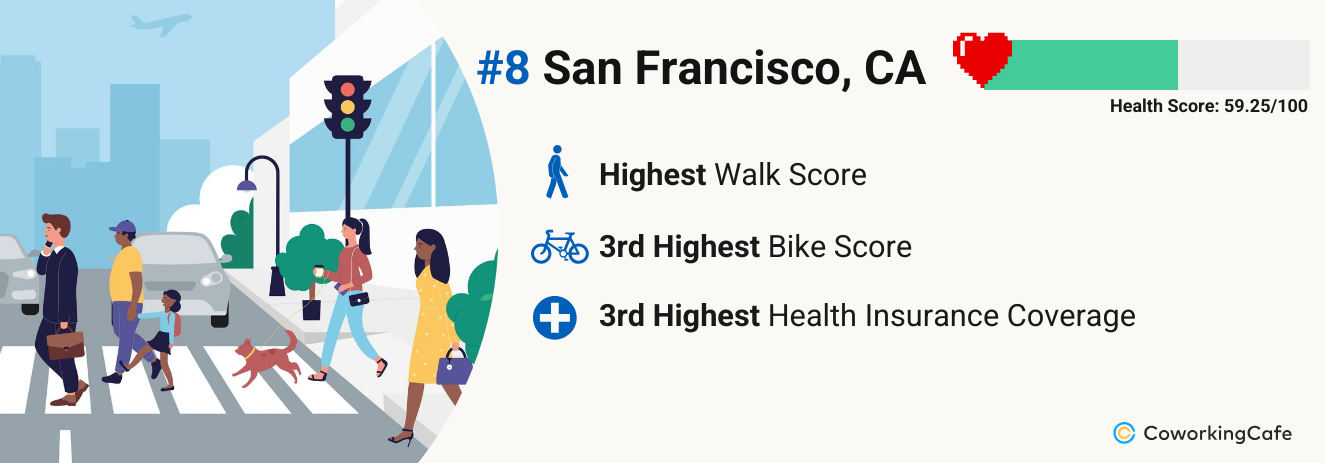 San Francisco excels in both physical and mental health support. It ranks third for health insurance coverage, with over 96% of residents insured, and offers 23 mental health care offices per 100,000 people—demonstrating a strong commitment to emotional well-being.
The city also supports an active lifestyle in multiple ways—residents can choose from 252 fitness centers, enjoy the most walkable streets in the country, or cycle along an extensive bike network. Access to healthy food isn’t hard to find either—57 grocery stores, supermarkets, and specialty shops per 100,000 residents help support a balanced diet.
 Richmond’s fifth place in the life quality metric is fueled by an array of factors—little time spent commuting, high healthcare coverage rates (90.2%), low pollution levels, and strong purchasing power are just a few things that add to the city’s great results.
Taking a closer look at the city’s pollution situation, we can notice that Richmond has the eighth best score in air quality. The city stays well below 50 AQI, which is the benchmark for good air quality, according to the U.S. Air Quality Index. Furthermore, with high allergy and asthma rates, Richmond’s residents and local government are responding through volunteer programs and diligent air-quality checks led by both citizens and officials.
Of course, healthy eating is easier when you have variety, and Richmond provides nearly 60 stores per 100,000 residents with healthy food and plenty of dietary diversity. Additionally, when it comes to exercising, the city makes it easy to stay active with 71 sports centers and 184 parks to choose from.
 Madison rounds out our top 10, standing out with the third-best average air quality. Although it faced difficulties after the 2023 Canadian fires, the city bounced back with several solutions to keep air pollutants in check. One initiative was the installation of the first of 65 new air-quality monitors to gather data on particulate matter pollution — tiny pieces of airborne dust, dirt and other materials.
However, fresh air isn’t the only health benefit that ensured the city’s top-10 placement. The capital of Wisconsin also boasts the fifth-best health insurance coverage with more than 95% of residents having access to regular care, preventive services and timely treatment — without the burden of overwhelming costs.
Mental health also takes priority in Madison with 20 practitioners per 100,000 residents.
Expert insights
 Tyler Quinn
What are the biggest challenges that people living in an urban setting face when it comes to maintaining a healthy lifestyle?
Urban residents often face structural barriers that make it difficult to engage in regular physical activity — limited green space; unsafe or disconnected pedestrian and cycling infrastructure; and long commute times are just a few. But, beyond physical infrastructure, social factors play a critical role. In one of our recent studies, we found that individuals living in neighborhoods with higher social cohesion — where neighbors trust and support one another — were significantly more likely to meet recommended guidelines for both aerobic and strength physical activity. This highlights that, even when physical spaces are available, social connectedness can influence whether people feel safe and supported enough to use them.
Additionally, our earlier work on active commuting found that flexible work schedules, shorter distances to work, and urban residence were associated with increased odds of walking or biking to work. Unfortunately, these enabling conditions are not equitably distributed across the population, leading to disparities in who can realistically build movement into their daily routines.
Here are two papers about the associations between work factors and transportation-related physical activity, as well as the neighborhood social environment and physical activity.
Read more…
What measures could be taken to implement healthier living conditions on a personal, community or legislative level?
At the community level, equitable investment in infrastructure is critical. Accessible sidewalks, safe cycling networks, public green space and well-maintained parks can encourage routine activity. In our earlier work, we demonstrated that workplace factors and urban design features — such as shorter commutes and flexible work hours — significantly increased the likelihood of active commuting. Importantly, interventions that combine infrastructure with social support — such as programs to enhance neighborhood social cohesion — can further increase engagement in physical activity.
From a policy perspective, a growing body of evidence highlights the importance of integrating physical activity into broader urban planning and health surveillance frameworks. Our recent work using national data has revealed critical nuances often missed by traditional surveillance systems. For instance, in a national study of working adults, we found that those employed in high-activity occupations were significantly less likely to meet physical activity guidelines during leisure time, especially among those working long hours. This has important implications: Focusing only on leisure-time activity may underestimate total physical activity and misrepresent certain groups — such as Hispanic or Latino workers and those with lower educational attainment, who are disproportionately represented in physically demanding occupations.
These findings suggest that future public health and policy approaches must expand beyond leisure-time activity promotion alone. Incorporating total physical activity (across work, transportation and household domains) into both policy assessment and intervention design will better support population health and ensure that all groups are accurately represented and equitably served.
What are some active steps you’ve taken and you advise others to take, as well, that improved your physical and mental wellness?
Personally, I prioritize routine outdoor movement — even short daily walks can help reset focus and support mental well-being. I also advocate for creating routines that build movement into your day, rather than saving it only for structured exercise. Making physical activity social — whether it’s a lunchtime walk with a colleague or an after-dinner family bike ride — can help sustain healthy habits in a busy life.
Methodology:
For this study, we analyzed 66 U.S. cities with complete datasets across a series of 10 health-related metrics. The metrics were weighted according to their importance in maintaining a healthy environment for residents and the final scores were compared to determine the final ranking.
- Life-Quality Index (15% weight) – Composite index evaluating quality of life based on cost of living and purchasing power; housing affordability; pollution levels (air, water, etc.); crime rate; health system quality; traffic; and congestion levels. Higher-index values indicate a better quality of life. Source: Numbeo (2025).
- Fitness Center Density (15% weight) – Total number of fitness and sports establishments per 100,000 residents. Source: U.S. Census Bureau (2022).
- Healthy Food Availability (10% weight) – Number of grocery stores, supermarkets, and specialty stores that offer healthy food options per 100,000 residents. Source: U.S. Census Bureau (2022).
- Park Score (10% weight) – Park resources on a 0 to 100 scale with points awarded relative to the 100 largest U.S. cities across five categories — acreage, investment, amenities, access and equity. Each city’s total points (out of a maximum of 500) are normalized to a ParkScore rating of up to 100, which is the best score a city can get. Source: ParkScore (2024).
- Air-Quality Index (10% weight) – Daily average air quality obtained by tracking the level of six atmospheric pollutants (ground-level ozone, particle pollution, carbon monoxide, sulfur dioxide and nitrogen dioxide) on a 0 to 300 scale. Lower AQI indicates better air quality. Source: United States Environmental Protection Agency (2024).
- Noise Pollution (10% weight) – Quantifies residents’ exposure to a city’s transportation noise levels, which can span from 45 decibels to more than 90 decibels. The World Health Organization defines anything above 65 decibels as noise pollution. Source: Department of Environmental and Occupational Health Sciences (2020).
- Health Insurance Coverage (10% weight) – Health insurance coverage rate, taking into account both private and public insurance. Source: U.S. Census Bureau (2023).
- Mental Health Care Density (10% weight) – Number of offices that provide mental health practitioners per 100,000 residents. Source: U.S. Census Bureau (2022).
- Walk Score (5% weight) – Walkability and pedestrian-friendliness score based on the availability and length of walking routes to nearby amenities, considering every city block, weighted by population density. Source: WalkScore (2021).
- Bike Score (5% weight) – Cycling conditions rated on a 0 to 100 scale, factoring in bike lanes, terrain, road connectivity and commuting rates, weighted equally. Source: WalkScore (2021).


