
This ranking highlights the UK’s most efficient local economies: The places where each hour worked converts into exceptional economic value, supported by strong employment and business networks.
The UK’s Efficiency Puzzle & Why Productivity Matters
Across the country, a number of local economies are achieving something crucial: They’re converting each hour of work into more economic value than others. And, when workers produce more value per hour, the influence extends far beyond the charts in year-end presentations. Beyond feeding company cashflows, higher productivity also increases tax revenue, which, in turn, supports core public services. Understanding where work is most efficient therefore becomes not only an economic exercise, but also a social one.
At national level, the UK’s efficiency problem has shaped the economic conversation for almost two decades. Namely, until the financial crisis of the late 2000s, productivity grew steadily, averaging around 1.6% a year. But, since then, growth has averaged just 0.5% — leaving productivity levels only marginally higher than they were in 2010 and around 26% below where they would be, had the pre-crisis trend held (Fig. 5, p. 7). That said, the national picture hides places that have charted a very different path.
Our ranking evaluates 15 of Britain’s most efficient cities by using a combination of labour productivity, employment strength, job and business density, as well as work hours as a contextual indicator of work intensity. The result is a map of places where work is not just abundant, but economically effective:
Key takeaways:
- Many of the UK’s highest-output engines are small or mid-sized cities, leading the way in overall economic effectiveness.
- Berkshire alone is home to four of Britain’s most efficient local economies, including Slough at #1.
- Britain’s “efficiency belt” clusters in the South East with many small cities outperforming the capital on work dynamic and economic vitality measures.
- Strong labour markets and business communities help cities like Edinburgh, Warwick and Stratford-upon-Avon thrive well outside of London’s orbit.
- Hourly productivity brings cities like Cambridge; Brighton & Hove; St Albans; and Southampton into view, driven by specialised, high-value sectors, such as life sciences, digital and professional services.
The London-Orbit Efficiency Engine
A ring of fast-growing cities around the capital forms the UK’s most economically effective work corridor. While public data reveals that this belt of high-performing local economies leverage their links to London, they’re also cultivating their own high-performing business and employment environments by developing distinctive strengths of their own. As such, success can have multiple formulas: Some cities win on output per hour, whereas others excel via deeper, more complex economic ecosystems.
First, Slough tops the national ranking overall and labour productivity metric at £68.2 gross value added per worker per hour, on average (GVA/h). This performance is driven by a concentration of corporate headquarters, high-value service firms, and major logistics operations linked to the Slough Trading Estate and the wider Heathrow corridor — home to firms such as O2, Mars, Ferrero, Reckitt and other multinational operators.
Slough is also the hardest-working city in the country, recording the longest average work week at 39.8 hours. Rather than diluting performance, these longer hours reflect the intensity of work in its dominant sectors, which helps the city sustain its exceptional levels of output. Meanwhile, job and business density sit mid-table, even as Slough’s position is secured by the sheer value that its workforce generates.
Nearby, Wokingham ranks third overall, boasting the country’s third-highest labour productivity at £61.5 GVA/h, in addition to the eighth-strongest business density at 729 enterprises per 10,000 working-age residents. This concentration of knowledge-intensive firms spanning science, tech, and professional services — especially in R&D (food, pharma), IT and energy — gives Wokingham one of the most technically skilled local labour pools in the South East and the Reading-Bracknell tech corridor. What’s more, its stable employment level of 76.4% and a near-parity state of 0.9 jobs per worker place it firmly among the stronger performers nationally on core economic vitality measures, thereby reinforcing its status as one of Britain’s most effective local economies.
To the south, Sevenoaks finishes sixth on the list of Britain’s most economically effective hubs. Here, its strong entrepreneurial spirit is underscored by the fourth-highest business density in the country with roughly one enterprise per every 10 working-age residents. No doubt, this has to do with a high concentration of skilled professionals who are self-employed and leveraging the proximity to London, as well as the strong local economy.
To the west, Basingstoke ranks seventh overall and fifth in productivity, reflecting the influence of established corporate employers and a diversified business base. In this case, job and business density are mid-range, but the area consistently converts work hours into meaningful output, supported by a healthy employment rate of nearly 80%.
Not far behind, Winchester offers a distinctive form of economic effectiveness with the highest business density in the country, as well as the strongest job density, thanks to a large share of retail, health care, public administration and service-sector roles drawing workers into the city from surrounding Hampshire districts. On the flipside, its productivity metrics place it in a lower tier. Make no mistake, though: The £41.5 GVA/h is on par with the performance of cities like Leeds or Oxford. That said, Winchester’s economic effectiveness is clearly more ecosystem-led at the moment, which may unlock higher productivity over time.
Staying in the same general area, Reading remains one of the UK’s strongest economic hubs with balanced performances across multiple pillars. Although it misses the top 10 overall, it nevertheless snatches ninth place in productivity and employment, even climbing to eighth place in job density. Part of the wider M4 knowledge economy, the area hosts substantial tech and professional-services clusters, concentrating significant software, telecoms, finance and consultancy expertise. Accordingly, these generate both high hourly output per worker to reach an average of £48.5, in addition to a solid supply of jobs at 1.2 workplaces per working-age resident.
Then, in 12th place overall, Chichester boasts the third-highest business density (ahead of Sevenoaks) and displays strong job density with a little more than one job per resident to rank 11th nationwide. As such, it shares ninth place with Reading for employment at 82.4%. However, its productivity sits far lower: The £41.5 GVA/h places it only 47th nationally. Even so, a highly active service-sector economy, a dense network of firms and one of the hardest-working populations averaging 38.7 hours per week sustain Chichester’s strong overall effectiveness.
Hot on Chichester’s heels, Bracknell rounds out the London-area leaderboard for economic effectiveness, taking seventh place for productivity (£51.6 GVA/h) and employment rate (82.8%). This is hardly a surprise given the city’s skilled workforce anchored in specialist industries, such as IT services, software, engineering, and corporate support functions, and supported by major employers, historically including Fujitsu, Dell, HP and other tech-oriented firms. While this concentration of fewer, large employers and the city’s good commuter links to London push its business and job density scores further back lower in the distribution, Bracknell’s vigorous private sectors ensure consistent productivity and employment rates, ranking seventh nationally for both metrics.
London as a Reference Point in the National Picture
To see the full shape of this pattern, London needs to be brought into the frame, even though we excluded it from the ranking in order to maintain objective comparability. However, this doesn’t change the fact that the capital is home to the country’s largest cluster of jobs and businesses in absolute terms, and its direct influence stretches across a wide corridor of the South East.
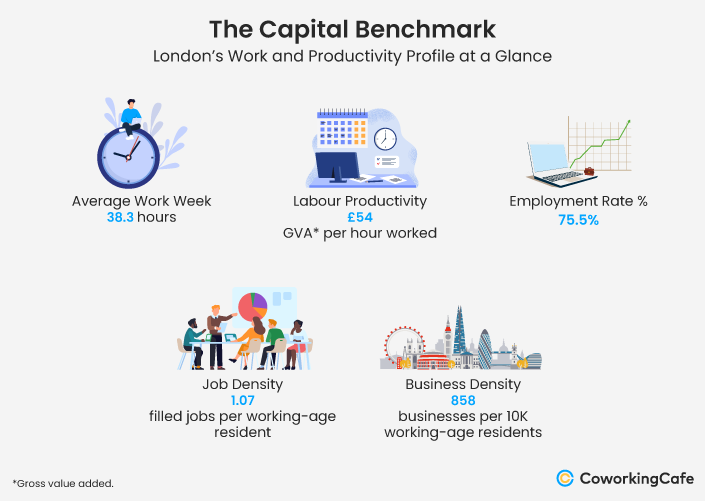
Yet, when work dynamics and economic vitality are measured, London does not sit at the top. In fact, its labour productivity (at £54 GVA/h) falls below several of the highest-performing cities both within and beyond its orbit, including Slough, Swindon, Wokingham and Milton Keynes. Similarly, whereas London’s job and business density are high in absolute terms, on a per-capita basis, a number of smaller cities rival or surpass it, thereby reflecting dense local ecosystems that operate at different scales.
Thus, London has a dual role: It acts as an economic catalyst, powering the growth of many nearby cities, while also serving as the universal touchstone — setting benchmarks that several of those same places often exceed.
And, as we’ll see below, this pattern is not confined to London’s close orbit. Instead, some of the strongest performers sit hundreds of miles away, demonstrating that high economic effectiveness is not simply a byproduct of sitting close to the fire, but rather the result of industry strength and specific local workforce dynamics — from exceptionally high employment engagement to concentrated business activity or unusually dense job markets.
Where Economic Effectiveness Stands on Its Own: Regional High Performers Beyond the South East
Further from London, a set of high-performing regional cities demonstrate that efficiency can be entirely independent of the capital’s influence. These places thrive on their own economic logic, powered by knowledge sectors, innovation, tourism, and other region-specific business environments and workforce structures that support sustained value creation.
In this respect, Swindon ranks second overall, driven by exceptionally strong labour productivity at £62.1 GVA/h and a stable, 77% employment rate. Granted, its job and business density are average, but Swindon’s position along the M4 corridor supports advanced manufacturing, logistics and professional-service roles. The area also benefits from long-standing corporate operations in engineering, financial services, and research-intensive sectors alongside major redevelopment activity, including the transformation of the former Honda car plant into Panattoni Park, a project anticipated to generate around 7,000 jobs. This mix of strong productivity and reliable workforce engagement positions Swindon as the most economically effective city in the South West, by far.
Back in the South East, Milton Keynes reinforces its reputation as one of the UK’s most dynamic urban economies that stands on its own feet, rather than relying on London’s pull. That’s because its economic base spans major national and international employers, in addition to an unusually dense small and medium-sized enterprise scene, particularly in professional, scientific and technical fields. This mix helps sustain upper-tier productivity at £50.6 GVA/h and broad labour-market strength. At the same time, employment sits at 80.3%, and a job density of 1.06 makes Milton Keynes a net job importer, drawing in workers to support its fast-growing economy.
Leading the West Midlands and ranked fifth nationally, Stratford-upon-Avon owes its high score more to its economic vitality metrics, rather than exceptional work dynamics indicators. Specifically, it has extremely strong business density, registering more than 950 businesses per 10,000 residents, while also boasting one of the highest employment rates in the country at more than 85%. Moreover, productivity stands at a confident £44.1 GVA/h, which is the 18th-highest average nationally.
Not to be outdone, Edinburgh is Scotland’s sole representative in the top 10, but it’s also one of the most productive regional entries with no less than £56.3 GVA/h. On top of that, the city logs an 83.2% employment rate and a strong job supply, exceeding the local workforce with 1.11 workplaces per eligible resident. Although its business-density figure is lower than that of several smaller cities, Edinburgh’s overall effectiveness comes from the strength and stability of its workforce and the breadth of its economic base.
The West Midlands rounds out the top 10 with another strong contender: Whereas Stratford’s efficiency was clearly ecosystem-led, Warwick has a more balanced profile. That said, coming in at 84.3%, its employment rate is still its strongest suite, despite falling behind Stratford due to a lower business density. Even so, Warwick has a clear edge when it comes to productivity, coming in at £46.8 GVA/h. A difference of nearly £3 per hour, that compounds quickly across a workforce clocking in 38 hours during an average work week.
In 14th place, Chester demonstrates that mid-sized cities can generate strong economic value without London’s influence. In fact, it’s comfortably in the top 10 when it comes to the key efficiency metrics with its productivity averaging £47.9 GVA/h and its employment rate standing at 82.6%. Although job and business density pull it back closer to the middle of the distribution with both ranking 27th nationally, its high workforce engagement and solid output more than make up for it, making Chester the clear efficiency leader of the North West.
East of England’s sole entry in the national top 15, Ipswich presents a more moderate, but nonetheless solid profile with mid-range productivity (£42.5 GVA/h), all while holding a strong, 80.5% employment rate and balanced job density. Of course, business density is lower, but its performance across multiple pillars is yet another testament to how economic effectiveness can emerge in varied regional contexts where mid-range productivity is offset by strong employment engagement and steady job availability.
How Productive Is an Hour of Work?
Labour productivity is the backbone of this ranking, but looking specifically at where the highest-value work occurs shows an even sharper picture.
As expected, focusing solely on this measure, the landscape shifts again: Overwhelmingly, productivity-led cities climb even higher with Edinburgh and Bracknell being the most significant examples. Meanwhile, others that scored well overall — such as Winchester or Chichester — fall out of the top tier because their strengths lie more in employment depth or business density, as opposed to pure hourly output.
Notably, a handful of cities outside of the main ranking also emerge — evidence that pockets of exceptional hourly productivity exist well beyond the main ranking’s top performers. For example, in Brighton & Hove, digital and creative-tech firms drive much of the city’s output; Southampton sees strong hourly gains largely from maritime services, advanced engineering and university-linked research; Cambridge is, of course, propelled by science, biotech and deep-tech industries; while St Albans stands out through its concentration of professional and knowledge-based services.
Together, these cities highlight that the UK’s most efficient work isn’t always happening where people work the longest, but rather where high-value, expertise-heavy industries create good conditions for high-value work.
A Blueprint for Prosperity?
The UK’s most efficient cities offer a new way of understanding economic potential. More precisely, they show that productivity is no longer synonymous with size or location, and that every hour of work can create more value when the right economic conditions exist.
If Britain’s future depends on doing more with less, the lessons may already be written in the workday rhythms of its most efficient cities — from the commuter belt to the Scottish capital and from tech hubs to heritage towns. Now, the challenge is scaling what works.
Methodology
To set up this ranking, CoworkingCafe compared all UK cities with complete data for the metrics below and assigned each a score based on the following data points and weightings:
1. Work Dynamics – 60% of the total index
- Labour Productivity – 70% [ONS Local Statistics (2023)]
Gross Value Added (estimated value of goods and services produced) per hour worked.
- Average Work Week – 30% [ONS – Annual Survey of Hours and Earnings (October 2025)]
Average number of paid hours worked for full-time employee jobs.
2. Economic Vitality – 40% of the total index
- Employment Rate – 35% [ONS (Nomis) – Annual Population Survey (July 2024 – June 2025)]
Share of the working-age population currently in paid work.
- Job Density – 35% [ONS (Nomis) (2023)]
Total number of filled jobs in an area divided by its resident population aged 16-64 (workplace-based, comprising employees, self-employed, government-supported trainees and HM Forces).
- Business Density – 30% [ONS (Nomis) – Inter Departmental Business Register (March 2025)]
Number of businesses per 10,000 working-age residents.


