
In the third quarter of 2025, coworking stood as a firmly established segment of the U.S. office market with thousands of flexible workspaces across the country serving professionals, startups, and companies that rely on adaptable environments to meet hybrid work needs. From large, corporate hubs to local community spaces, coworking has become a standard feature of how and where work happens in the United States.
Due to recent refinements in our data collection methodology, quarter-over-quarter comparisons of the number and square footage of coworking spaces are not included in this report. The figures presented reflect the most accurate information available at the time of publication. As we implement these methodological updates, future reports will resume comparisons.
More Than 8,400 Locations Mark Coworking’s Move From Volatility to Stability
Across the United States, coworking now spans 8,420 locations — a figure underscoring how deeply embedded the coworking model has become within the country’s office ecosystem. Even so, coworking still accounts for only a small share of the overall office market.
In general, over the last 12 months we’ve seen solid consistent growth despite a mid-year lull, pushing overall space to more than 150 million square feet. Maybe the most eye-opening number is coworking is still only 2.1% of office space, showing there is plenty of additional opportunity for growth.
Peter Kolaczynski, Director Yardi Research
The numbers show a market that has moved from the post-pandemic unpredictability to a steady rhythm of refinements: Operators are no longer hunting for saturation, but rather targeting stability. Accordingly, the sector keeps growing, albeit in deliberate and calculated ways, such as space enlargement, better locations and clearer pricing bands.
Coworking has traded volatility for viability. Our industry isn’t chasing endless growth anymore, it’s building it deliberately, one stable location at a time.
Sam Rosen, Director Coworking
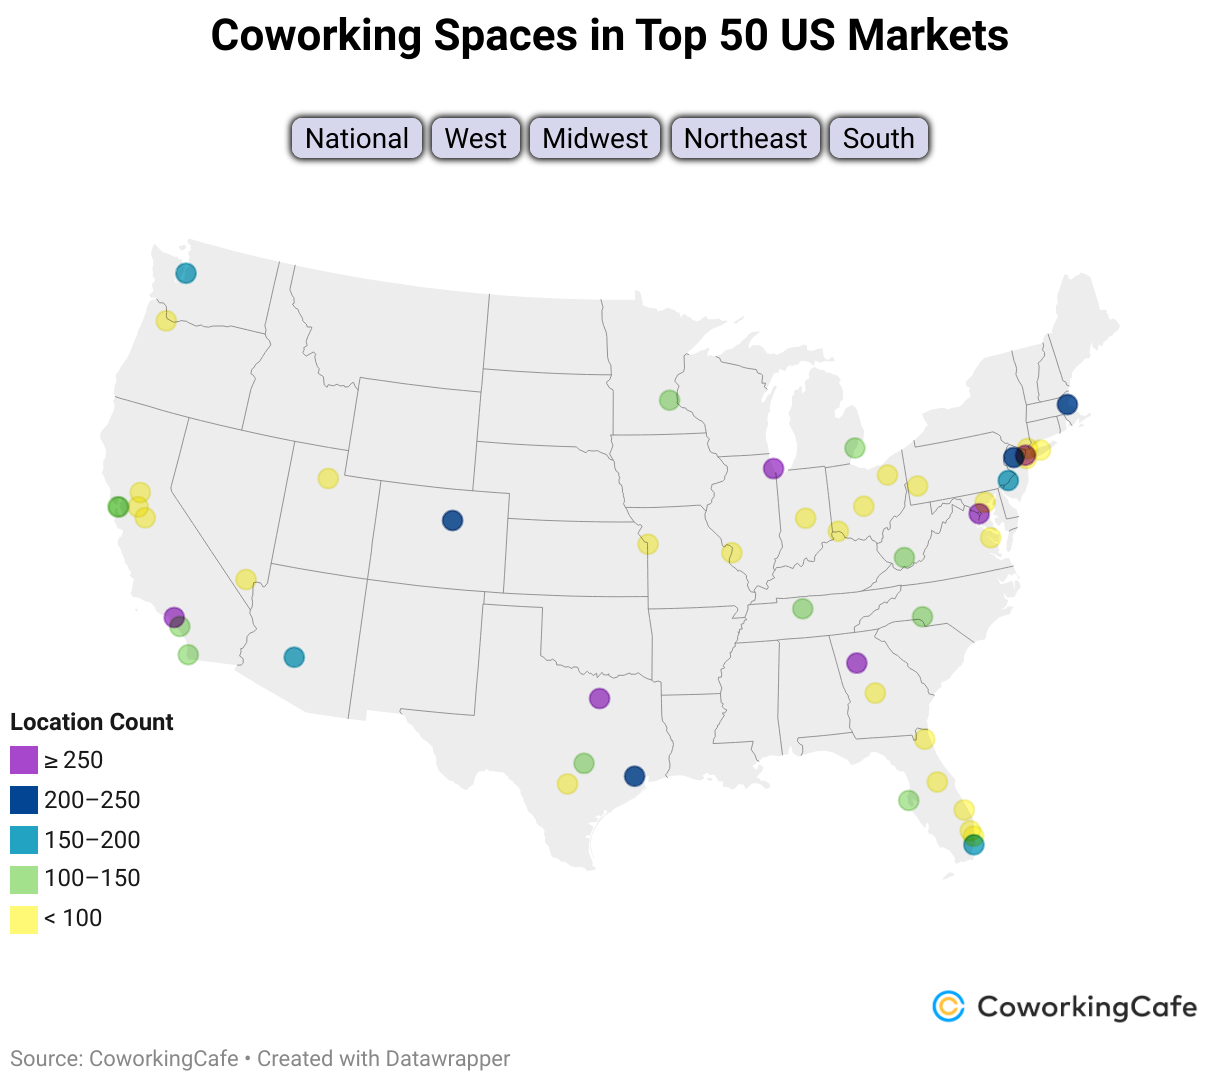
Regionally, growth remains well-distributed. Specifically, the Northeast retains the highest coworking density, driven by Manhattan, NY; Boston; and northern New Jersey, where demand continues to outpace supply. Not to be outdone, the South maintains its strong trajectory through business-friendly markets, such as Dallas–Fort Worth, Atlanta, and Miami, while the Midwest sees steady, healthy progress in Chicago, Minneapolis and Columbus, OH. Meanwhile, out West, Los Angeles, San Francisco, and Orange County anchor the region’s coworking base, complemented by rising hubs, such as Denver, Phoenix and Salt Lake City.
Key Insights
- The coworking industry added new space selectively, reaching more than 152 million square feet across 8,420 locations nationwide.
- Secondary cities like Dallas–Fort Worth, Atlanta, Denver, and Phoenix continue to capture momentum, proving that coworking has matured into national infrastructure—not just a big-city phenomenon.
- National median rates stabilized at $225 per month for memberships and $30 for day passes, reflecting healthy occupancy and competition-driven price discipline.
- Average site sizes sit at 18,000 square feet nationally, with major metros exceeding 25,000–40,000 square feet per location as operators favor multifunctional layouts and enterprise suites.
While Manhattan Leads in Density, Coworking Takes Root Far Beyond the Coasts
By number of locations, Los Angeles holds the top position in Q3 2025, with 322 coworking spaces totaling roughly 7.2 million square feet reflecting the fragmented yet active nature of California’s coworking ecosystem. Dallas-Fort Worth follows with 310 spaces and a total inventory of 5.8 million square feet. Manhattan, NY, though smaller in count, remains unmatched in overall scale — its 287 coworking locations occupy a notable 12 million square feet, representing the densest coworking landscape in the country.
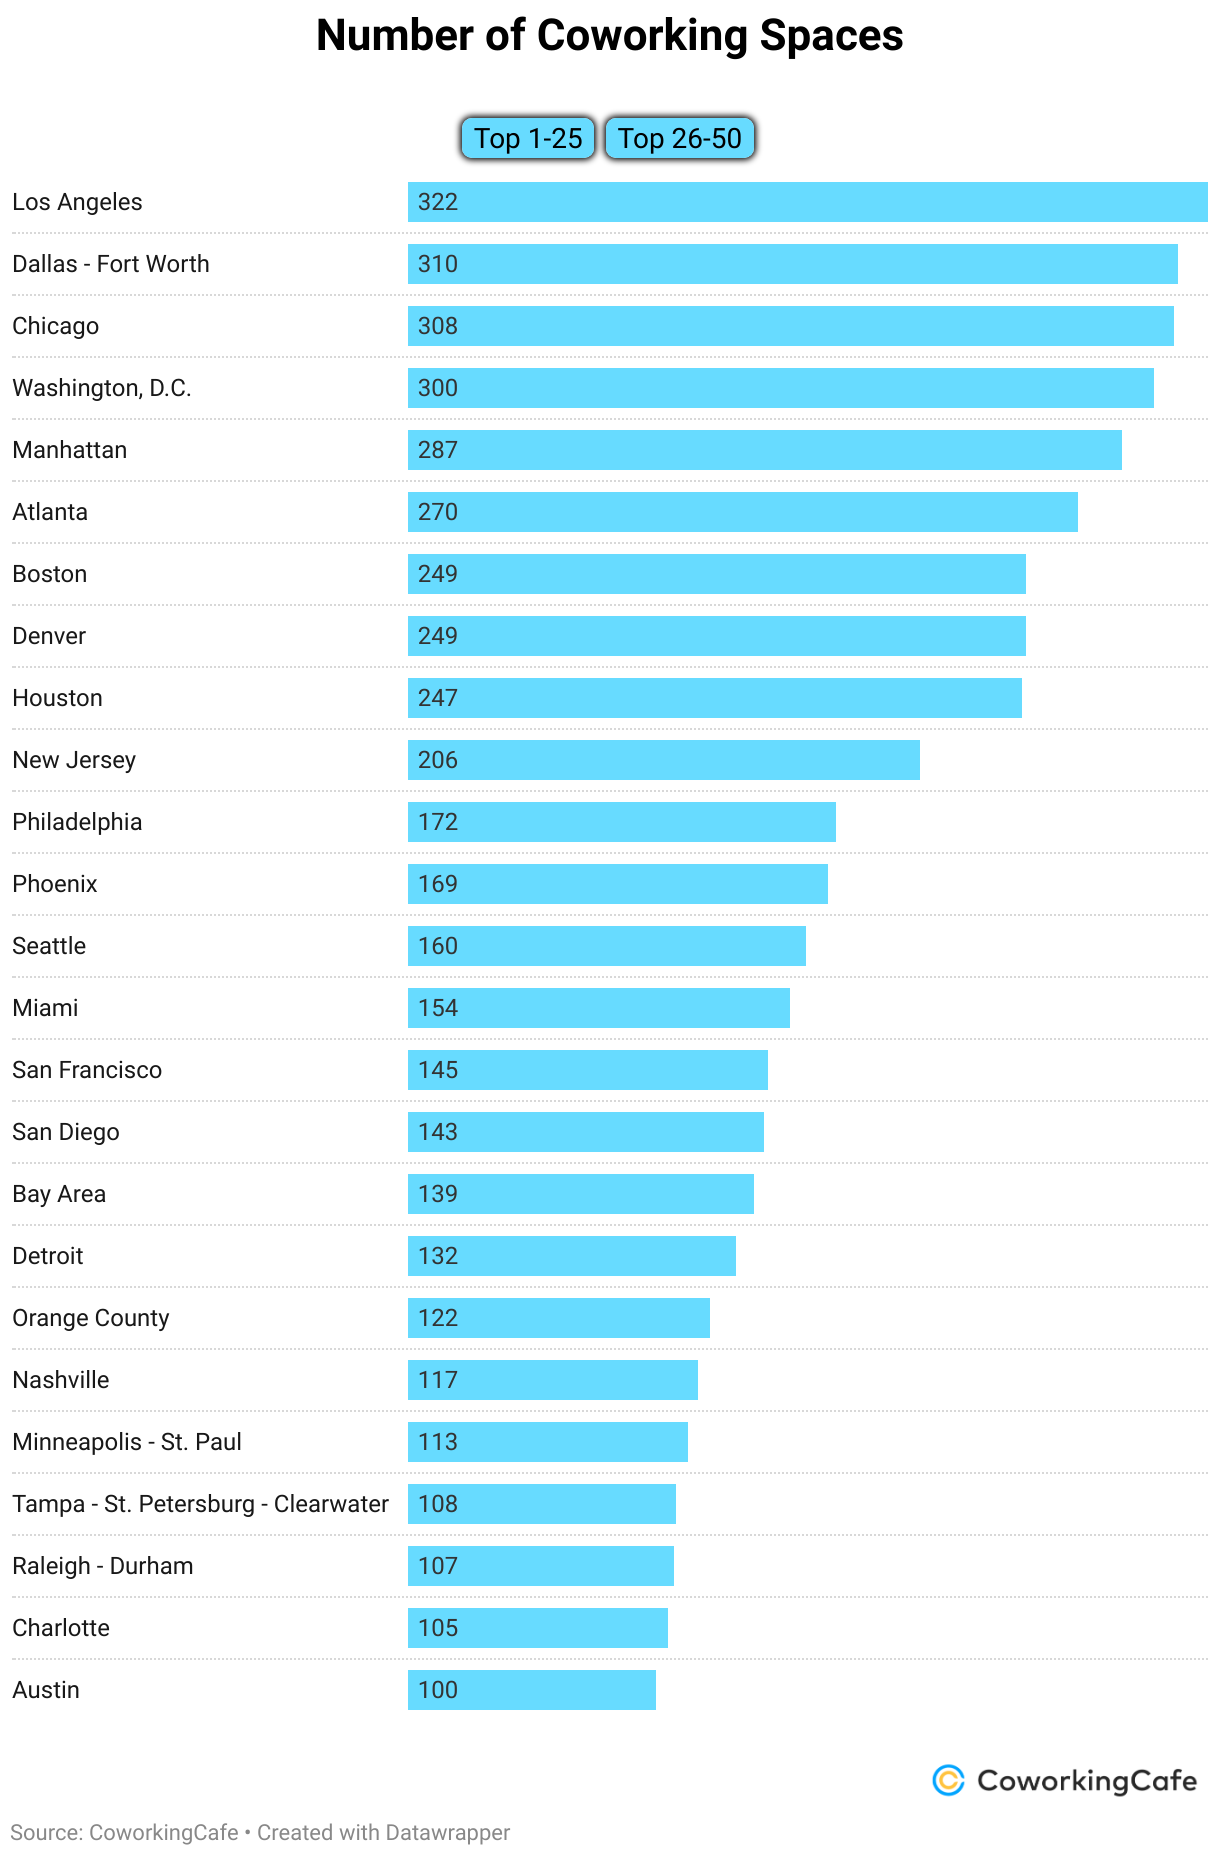
With well over 280 coworking locations each, Dallas–Fort Worth and Atlanta are key pillars of the Sun Belt’s flexible work network, showing just how deeply coworking is embedded in the region’s business infrastructure. Similarly, Houston and Denver, which are each home to more than 200 active spaces, reflect a broader national trend in which distributed workforces are pulling the center of gravity away from traditional downtown cores.
At the same time, Raleigh–Durham, NC; Nashville, TN; and Phoenix — all approaching or surpassing 180 coworking sites — have outgrown their “emerging market” statuses. Together, they form a new line of urban suburbs where professionals can access premium workspaces close to home and without the long commutes into central business districts.
Notably, Q3 data also shows that coworking is beginning to cluster along regional corridors, with nearby cities expanding in tandem, rather than in isolation. In particular, Texas now represents one of the country’s largest coworking ecosystems with Dallas, Houston, Austin and San Antonio collectively hosting more than 600 flexible workspaces.
Likewise, the Mid-Atlantic corridor — anchored by Washington, D.C.; New Jersey; and Philadelphia — records similar totals. Of course, D.C. remains the nation’s governmental office hub for hybrid workplaces, while New Jersey benefits from its proximity to New York City and a growing population of professionals who prefer suburban access to flexible office options.
Otherwise, in the West, Denver and Salt Lake City continue to rise as hybrid-friendly anchors for professionals who prioritize both affordability and quality of life.
Coworking is fast becoming an industry of everywhere. The most significant growth today is not confined to downtown towers; rather, it’s filling gaps in mixed-use neighborhoods and commuter corridors and breathing life into retail revitalization.
Average Sites Now Exceed 18,000 Sq. Ft. as Operators Adapt to Hybrid Work Demand
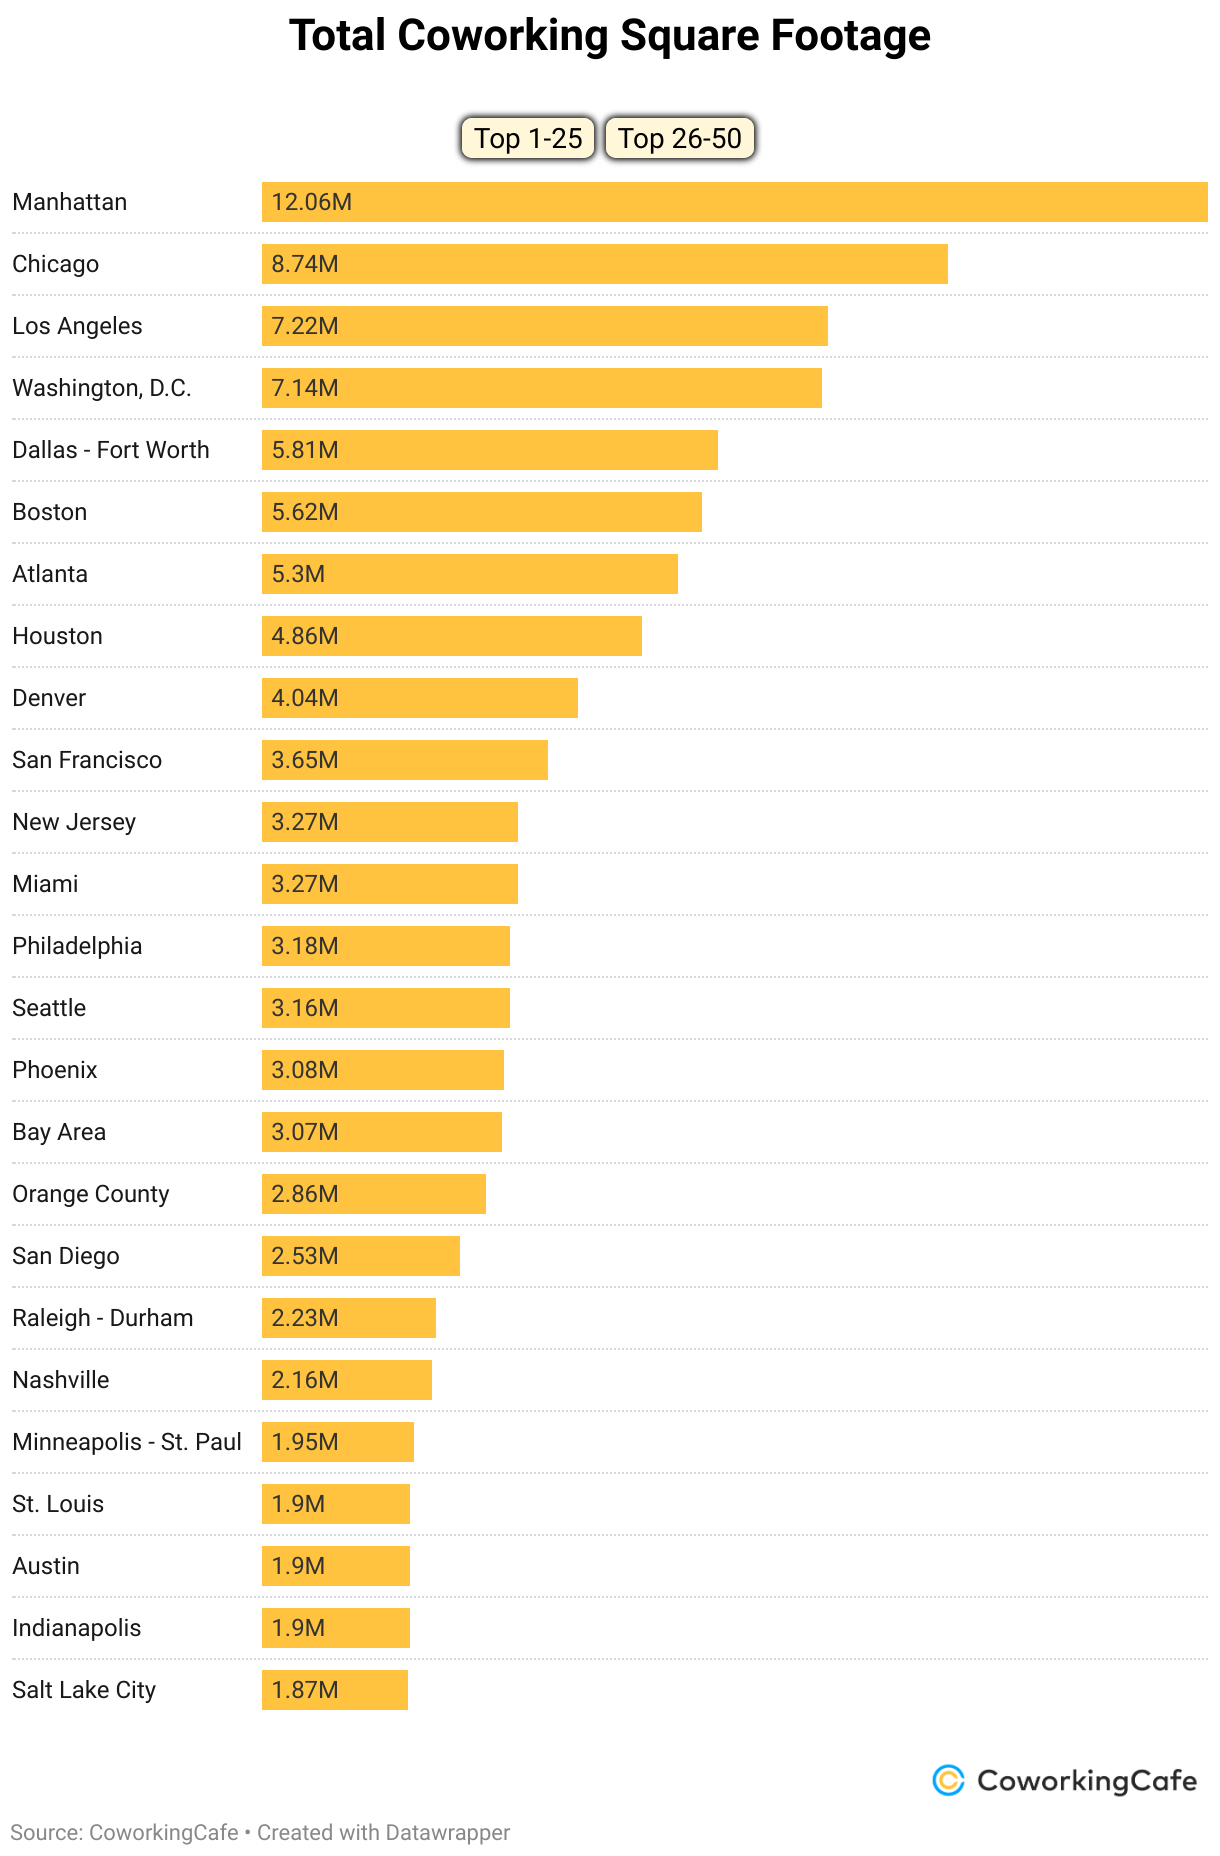
The distribution of total coworking square footage continues to reflect the economic geography of the U.S. office market. Manhattan. NY, leads by a wide margin with 12.06 million square feet — almost double that of the next-largest market, Chicago, which totals 8.74 million square feet. Los Angeles ranks third at 7.21 million, followed by Dallas–Fort Worth and Atlanta, both surpassing five million.
Average coworking site sizes remain closely tied to each metro’s development pattern. Manhattan maintains the largest average footprint in the country at just over 42,000 square feet per location, followed by Chicago at roughly 28,000 and Boston at 22,000. Major markets such as Los Angeles, Washington, D.C., and San Francisco cluster near 20,000 to 22,000 square feet, indicating a continued preference for large, multifunctional spaces in dense business environments.
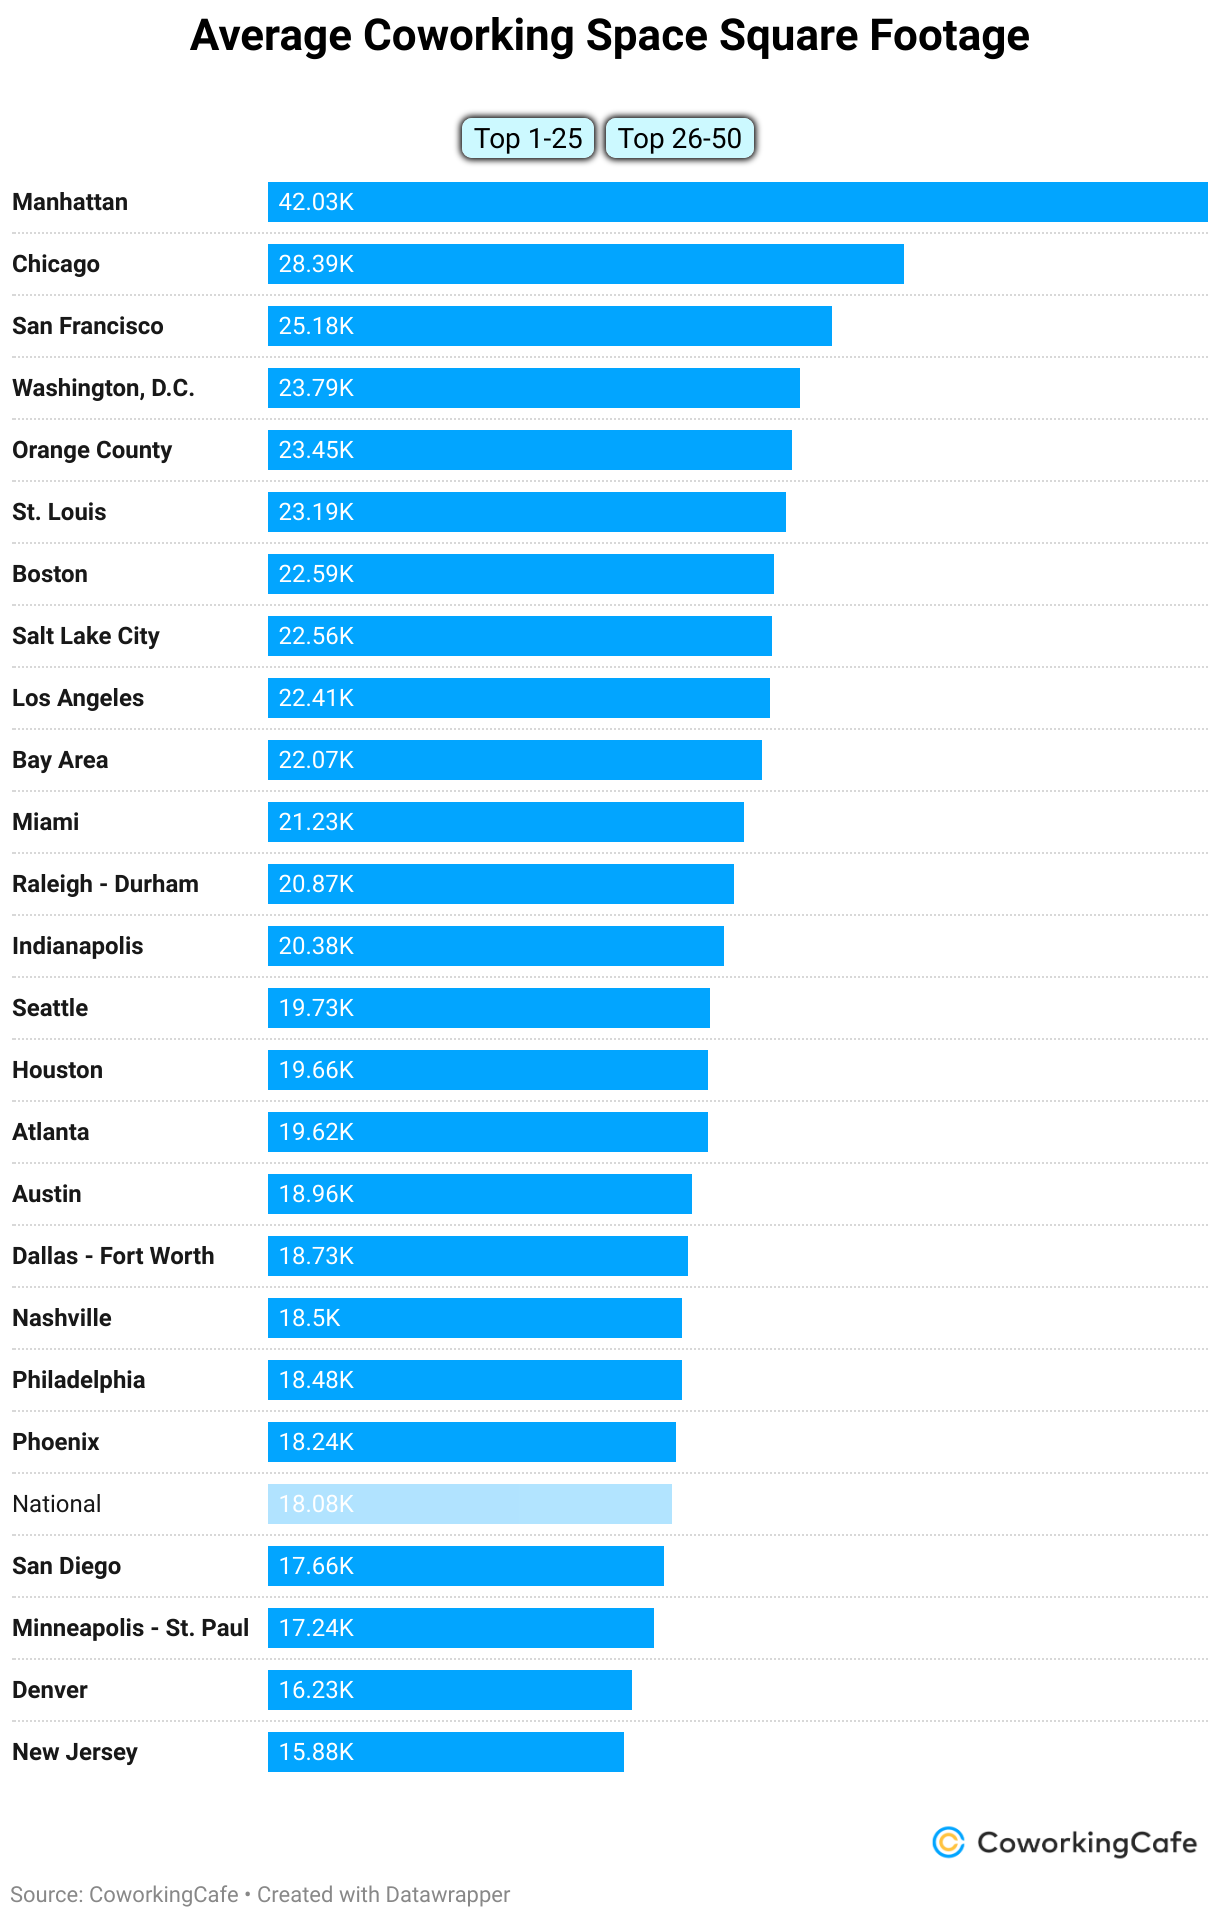
In contrast, mid-sized and emerging cities typically feature more compact but efficient layouts. In Raleigh–Durham, Salt Lake City, and Columbus, coworking sites average less than 20,000 square feet. These smaller footprints are often more tightly integrated with university campuses, startup corridors, and suburban business districts.
From a broader perspective, the national average of 18,080 square feet per location captures a market that has recalibrated toward operational efficiency rather than aggressive expansion. Larger footprints dominate high-density metros where hybrid enterprise demand is strongest, while smaller regional operators succeed through adaptive local design.
From High-End Hubs to Budget Markets, Flex Pricing Levels Out
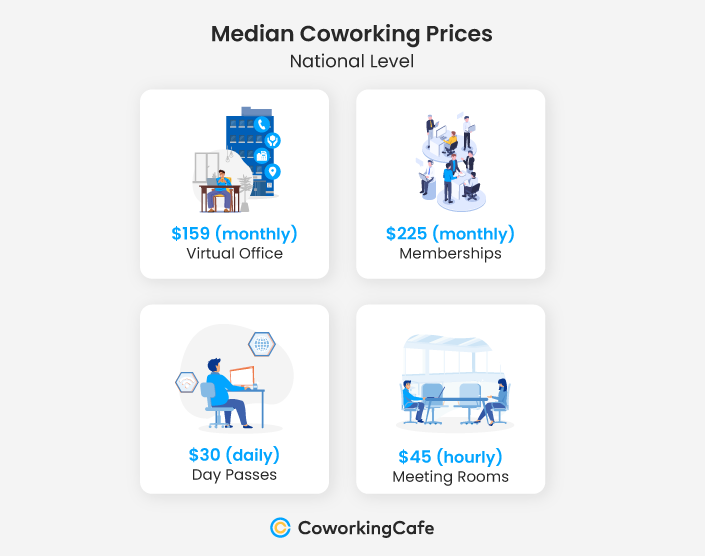
The pricing across the country continues to reflect a market that self-corrects and finds its stability. The open and dedicated desk median membership costs $225 per month nationally, day passes average $30, meeting rooms cost about $45 an hour, while virtual offices cost roughly $159 per month.
 Manhattan stays the undeniable outlier, fetching the highest rates in the nation. It has a borough-wide average of $339 a month for membership, meeting rooms renting for about $67 per hour, and day passes at $39. Brooklyn is second in command, at medians of $320 a month for membership, a sign that demand for flexible workspace is very strong even outside of the central business district.
On the West Coast, San Francisco, Los Angeles, and Orange County are also a premium cluster at about $230–$235 per month. These spaces frequently focus more on aesthetics and service rather than pure scale for professionals who pay to work in well-designed, placed spaces.
The South and Midwest tell a different story. Houston, Dallas, Atlanta, and Miami all sit clustered around the middle of the nationwide median, proving large-scale inventory and affordability can coexist. Memberships range from a low of $199 to a high of $235 per month, while day passes remain accessible; generally between $30 to $40, the region remains competitive, attracting hybrid teams and small businesses looking for cost-effective flexibility.
Then there are the efficiency markets: Salt Lake City, Columbus, and Jacksonville impress with their roughly $150 memberships combined with steady occupancy and salutary growth in total square footage. These metros have managed to succeed by compelled optimization rather than undercutting. Lower costs of living and real estate across these metros mean that operators can ensure profitability while still passing savings to members.
Taking a bird’s view, pricing has turned both rational and regional. The Northeast remains the most expensive, the South the most even-keel, and the West veers between the high-end indulgence of California and the more practical inland metros.
Regus, HQ, and Industrious Dominate, but Local Brands Continue to Gain Ground
Q3 operator data confirms that the industry has firmly consolidated around a few anchoring nationals with a lively network of local independents complementing. Regus remains the largest operator in the U.S., with 950 locations across the top 50 markets and roughly 1,185 nationwide. HQ follows with 274, while Industrious and Spaces each maintain just over 150. These brands collectively account for a substantial share of the country’s 152 million-square-foot inventory, particularly in core business markets.
VAST Coworking also holds a notable position among national operators, with 180 locations spanning more than 2.3 million square feet. Formed through the collaboration between Intelligent Office, Venture X and Office Evolution, its multi-brand framework illustrates the evolving structure of the coworking landscape, where diversified portfolios and shared operational models play an increasingly central role in the market.
Major clients keep driving occupancy within enterprise clients in major markets. National brands have doubled down on amenity-rich layouts, growing their private office portfolios and hybrid solutions designed for distributed teams. Meanwhile, small operators have found traction in mid-sized and emerging cities through community-driven concepts: coworking cafes, maker-oriented studios, and multi-use facilities doubling as event spaces.
Final Thoughts: Balanced Pricing and Occupancy Signal a Sector Built to Stay
What stands out most in Q3 is balance. The industry is neither in a boom nor in correction. In fact, the number of locations, total square footage and median prices all hint at coworking finally entering a period of normalization that is sustainable.
The data points to a sector that’s both confident and careful, growing in measured increments, expanding footprints only where hybrid demand is proven, and maintaining pricing discipline even as competition deepens. In its place, the volatility of the early 2020s has given way to a market that knows what works.
Methodology
- To compile this report, we used proprietary data from CoworkingCafe to determine the number of coworking spaces per market, as well as the total square footage and leading operators.
- The top 50 markets analyzed were established by our sister company Yardi Matrix and were ranked based on allocated square footage.
- In terms of pricing, we looked at the national median starting prices per person per month for virtual office, monthly memberships (open workspace + dedicated desk), day passes (daily open desk coworking) and meeting rooms (hourly booking).
- The study relied solely on the listing data available on CoworkingCafe as of October 2025.
- In this report, we have introduced adjustments to our data collection and sampling processes to enhance consistency and balance over time. The updated approach distributes sampling more evenly throughout the year to better capture ongoing market activity. As a result of these refinements, quarter-over-quarter comparisons of total coworking locations and square footage have been excluded from this edition to maintain analytical integrity and ensure comparability in future reporting.


