
The U.S. coworking market kept growing at a steady clip in the first quarter of 2026 — the kind of expansion we’ve come to expect quarter after quarter. But, the more interesting story is unfolding beyond the usual suspects: For the first time in several quarters, the biggest gains aren’t showing up in the gateway metros that have anchored every recent edition of this report. Instead, they’re appearing in mid-tier markets, where operators appear to be catching up to demand that has been building quietly for years.
In other words, coworking is growing from the middle out, and that’s a meaningful shift for a sector that, for most of the last decade, has been defined by what happens in a handful of marquee cities.
A Steady Quarter Nationally With Secondary Markets Leading Growth
By the end of Q1 2026, the U.S. coworking market reached 9,136 active locations, up from 8,854 at the close of Q4 2025 for a 3.2% quarter-over-quarter increase, or 282 spaces in just three months. The total allocated coworking footprint grew in parallel, expanding from 159.4 million to 163.9 million square feet for a 2.9% gain that added close to 4.5 million square feet of flexible workspace in a single quarter.
Notably, a subtle, but telling detail is that location growth slightly outpaced square footage growth this quarter — a sign that smaller-format spaces are entering the pipeline. As a result, the national average site size edged down from 18,000 to 17,945 square feet. Albeit a marginal change, it nevertheless points to a broader diversification of formats beneath the surface.
Despite all this growth, coworking still accounts for just 2.28% of total U.S. office inventory (up from 2.22% in Q4 2025), proving just how much runway remains for the sector.
Regionally, the South maintains the lead as the largest cluster by square footage, accounting for roughly 36% of top-50 market share across 18 qualifying metros, anchored by Washington, D.C.; Dallas-Fort Worth; Atlanta; Houston; and Miami. The West follows at 28% across 14 markets, led by Los Angeles; Denver; San Francisco and Seattle. The Northeast holds 23% across 8 markets where Manhattan, NY, continues to set the standard, and Philadelphia and New Jersey are stepping into much bigger supporting roles this quarter. The Midwest rounds out the top 50 at 20% across 10 markets, with Chicago, Minneapolis-St. Paul and St. Louis holding steady, in addition to Cleveland–Akron, OH, emerging as one of the quarter’s breakout performers.
For a real-time look at how every U.S. metro stacks up — including pricing and industry trends — explore the Yardi Coworking Index, which tracks coworking activity across the country as it evolves.
LA Leads Pack as Philadelphia Delivers Quarter’s Biggest Gain
Los Angeles closed Q1 2026 with 351 active coworking spaces, remaining the largest U.S. coworking market by count. But the metro added 13 locations during the quarter — a 3.8% gain that, while steady, is modest compared to the double-digit surges seen in secondary markets like Philadelphia and Tampa this quarter.
Dallas-Fort Worth followed closely with 337 locations, up from 323 in Q4 (+4%), reinforcing its role as one of the most expansive coworking hotspots in the country. Not to be outdone, Chicago reached 336 locations (+2%), while Washington, D.C., held essentially flat at 311 and Manhattan, NY, climbed to 308 (+3%). Atlanta is also inching closer to the 300-mark with 298 locations, up an impressive 6% — a sign that the Sun Belt’s appetite for flexible workspace isn’t slowing down.
Perhaps the most notable move this quarter came from Philadelphia. The metro added 22 coworking locations — the largest single-market gain in the top 50 — growing from 182 to 204 spaces, a 12% jump. Tampa-St. Petersburg, FL, delivered an equally dramatic performance, climbing 13% from 120 to 135 locations. On the opposite coast, Inland Empire, CA, also grew an impressive 12% to reach 64 locations.
Interestingly, these markets share a common profile — secondary or tertiary status; favorable real estate economics; and a growing hybrid workforce that had previously been underserved by national operators. Taken together, they point to a coworking industry that is no longer content to grow only where it’s already ballooned.
Of course, not every market moved in the same direction. For instance, Kansas City, MO, dropped from 64 to 61 locations (-5%) and Fort Lauderdale, FL, fell from 92 to 88 spaces (-4%). Nashville, TN, also slipped from 118 to 117, and Houston posted a slight pullback from 256 to 254 locations, although Houston’s total square footage still edged upward, suggesting that newer or remaining spaces are larger than those that closed.
Manhattan, NY, Still Leads in Footprint, but Mid-Tier Markets Gain the Fastest
When measured by total allocated square footage, Manhattan remains the undisputed leader with 12.76 million square feet — a figure that’s nearly 40% larger than second-place Chicago at 9.13 million. Los Angeles follows at 7.74 million; Washington, D.C. at 7.44 million; and Dallas–Fort Worth at 6.86 million. Additionally, Boston, Atlanta, and Houston all surpassed the 5-million-square-foot mark.
But the most compelling movement is happening below the top tier. Leading the charge this time was Cleveland-Akron, OH, which recorded the quarter’s largest percentage square footage gain at 11%, expanding from 1.27 million to 1.41 million square feet. Along the same lines, Baltimore, Philadelphia, New Jersey and Milwaukee all grew a whopping 10%.
These markets, in different ways, appear to be in the catch-up phase as demand has been building in mid-size metros for some time. Then, in Q1 2026, the supply finally arrived to meet it.
Not every market moved upward, though. Orlando, FL, and Nashville, TN, each posted small pullbacks of 1.6% and 0.8%, respectively.
Average Space Sizes Diverge as Formats Multiply
The national average coworking site size closed Q1 2026 at 17,945 square feet, slightly below Q4’s 18,003. While this movement seems marginal, beneath it lies a more interesting story. At the top end, Manhattan, NY, continues to tower above the rest at 41,440 square feet per location — by far the largest in the country. Chicago follows at 27,185 square feet; San Francisco at 25,529; California’s Orange County at 23,945; and Washington, D.C. at 23,914. These are the markets where enterprise-grade, multi-floor footprints remain the dominant format.
Average site sizes also shifted notably in several markets this quarter. Milwaukee posted the largest gain, with average location size climbing 12% quarter-over-quarter to 13,328 square feet. On the opposite end, Inland Empire saw the steepest decline, with average site size falling to 11,259 square feet.
The broader takeaway is that U.S. coworking is no longer a one-format industry. Instead, gateway markets continue to favor large, multifunctional floorplates that can accommodate enterprise tenants. Meanwhile, secondary and tertiary markets are increasingly defined by a mix of mid-sized hubs and compact, community-focused spaces. Accordingly, the national average is settling into a range, but the make-up behind that average is becoming more diverse quarter by quarter.
Pricing Holds Steady Nationally, With the Real Movement Happening Market by Market
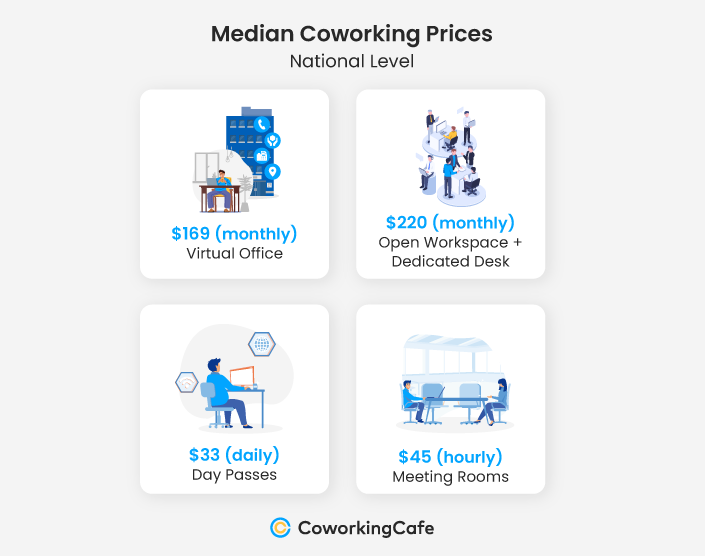
The national median membership rate (open workspace and dedicated desk combined) held flat at $220 per person per month, unchanged from Q4 2025. Meeting rooms stayed put at $45 per hour, while day passes witnessed an uptick from $30 to $33. Virtual offices also edged up from $159 to $169 per month. In other words, this is a quarter where pricing didn’t see a big change.
 That stability at the national level, however, masks a meaningful amount of activity beneath the surface. Several markets repriced sharply this quarter — some upward, some downward — and the patterns offer a useful read on where supply is tightening, where competition is intensifying and where new operator formats are reshaping the local price floor.
Manhattan, NY, remains the undisputed outlier at the top of the pricing chart, with memberships at $339 per month, day passes at $40 and meeting rooms at $70 per hour. Rates here saw very little change quarter-over-quarter, consistent with the borough’s deep demand base and its ability to sustain premium pricing regardless of national trends. Brooklyn, NY, meanwhile, follows at $320 per month for memberships — though that figure is down $19 from Q4 — a sign that the borough’s coworking pricing is beginning to moderate even as Manhattan holds the line.
At a distance, San Francisco, Los Angeles, Seattle, Boston and California’s Bay Area all cluster at $235 per month for memberships — a tier that has proven remarkably stable across recent quarters. What’s more, this cluster also includes Miami, New Jersey and Nashville, TN, each maintaining $235 memberships. A defined premium band has formed across geographically diverse markets where service quality and space design, rather than pure scale, drive rates.
In the South and Midwest, the middle of the pricing distribution remains active. Dallas-Fort Worth softened from $214 to $208 per month, while Chicago held at $199. Houston rose from $225 to $229, and Indianapolis climbed from $189 to $200. Perhaps the most striking movement came from Tampa–St. Petersburg, FL, where memberships jumped from $200 to $220 — a 10% increase that likely reflects tightening supply in a rapidly expanding market.
At the value end, efficiency markets continue to offer compelling price points. St. Louis memberships dropped from $165 to $150, Columbus fell from $163 to $150 and Salt Lake City held at $169. Raleigh–Durham, NC, also posted a notable decline, with memberships falling from $225 to $206, a pattern that often signals the arrival of more affordable operators in a market previously dominated by higher-priced legacy providers.
Regus Still Leads the Pack, With HQ and Industrious Posting the Fastest Growth Among the Big 5
Operator data for Q1 2026 confirms a market that continues to consolidate at the top, even as the bulk of activity takes place among thousands of independent and regional operators. The five largest national coworking brands — Regus, HQ, Industrious, Spaces and WeWork — collectively added 69 locations nationwide in Q1, growing from 2,044 to 2,113 total spaces. That’s a 3.4% aggregate gain, roughly in line with the 3.2% national rate.
Regus remains the clear national leader with 1,237 locations across the U.S., including 994 in the top 50 markets — an 80% top-50 concentration. Its 3.4% quarter-over-quarter growth reflects a continuation of the brand’s deliberate expansion into both gateway metros and secondary markets. HQ posted the fastest nationwide percentage growth at 4.5%, reaching 370 locations with an 81% top-50 concentration that mirrors Regus’s geographic approach. Both brands appear to be increasingly willing to push into smaller metros, something the data for this quarter makes clear.
Industrious tied HQ at 4.5% nationwide growth, reaching 184 locations. But there’s a striking caveat: 183 of its 184 locations sit inside the top 50 — a whopping 99.5% top-50-market concentration. Industrious’s strategy remains distinct from that of Regus and HQ. The brand is almost exclusively urban and enterprise-oriented, prioritizing premium markets and amenity-rich formats over broad geographic reach.
But the Big 5 tell only part of the story. Across the 120 U.S. markets tracked, 4,431 unique operators manage 7,032 locations. The Big 5 collectively control 2,113 locations out of 9,136 nationally — approximately 23% of the total. The remaining 77% is fragmented across thousands of independent, regional and boutique operators.
Final Thoughts: A Market Growing From the Middle Out
So, what does Q1 actually tell us? At the national level, not much new: 9,136 locations, 163.9 million square feet, 2.28% of total office inventory. Steady, healthy, on-trend. The kind of quarter that, on paper, looks like every other recent quarter.
However, the cities doing the most growing this time around aren’t the ones we usually write about. Cleveland, Baltimore, Philadelphia, Milwaukee, Tampa — these are the metros putting up the eye-catching numbers. They’re not stealing growth from the gateway markets so much as finally getting their turn, with operators, formats and pricing all lining up at roughly the same moment.
Meanwhile, the rest of the picture keeps shifting in small but telling ways. Average space sizes are pulling apart — bigger in some markets, much smaller in others. National pricing held flat, but individual markets repriced in both directions. The Big 5 keep growing, but the long tail of independents still does the bulk of the work. None of this looks like a sector in flux. It looks like one that’s matured enough to grow in several different directions at once.
Track the Market Between Reports: The Yardi Coworking Index
Quarterly reports are useful for the long view, but a lot can shift in 90 days. For readers who want to keep tabs on the U.S. coworking market in something closer to real time, our team also maintains the Yardi Coworking Index — an interactive, monthly-updated dashboard that pulls together CoworkingCafe and Yardi Matrix data into a single, browsable view of the sector.
The Index covers more than 120 U.S. markets and is built around the same data we use to compile this report — but with the advantage of being refreshed every month, rather than every quarter. Users can look up any tracked metro to see its current location count, total coworking square footage, and other industry trends.
Methodology
- To compile this report, we used proprietary data from CoworkingCafe to determine the number of coworking spaces per market, as well as the total square footage and leading operators.
- The study relied solely on the listing data available on CoworkingCafe as of March 2026.
- The top 50 markets analyzed were established by our sister company Yardi Matrix and were ranked based on allocated square footage.
- In terms of pricing, we looked at the national median starting prices per person per month for virtual office, monthly memberships (open workspace + dedicated desk), day passes (daily open desk coworking) and meeting rooms (hourly booking).
Fair Use & Redistribution
We encourage and freely grant you permission to reuse, host or repost the images in this article. When doing so, we only ask that you kindly attribute the authors by linking to CoworkingCafe.com or this page so that your readers can learn more about this project, the research behind it and its methodology.


